Türkçe
 Español


Solana (SOL) price experienced a significant pullback in the last 24 hours and is currently trading below the crucial threshold of $160. This downward trend led to a drop of over 3%, bringing SOL’s price down to $153. As a result, Solana’s market cap fell to approximately $70.85 billion, positioning it as the fifth-largest cryptocurrency. Despite this price drop, Solana’s 24-hour trading volume increased by 65%, reaching $2.41 billion, indicating significant market activity.
Is There an Upswing on the Horizon for Solana Coin?
Over the past week, Solana coin faced consistent downward pressure characterized by lower highs and lower lows. The altcoin has been trading in the range of $175 to $150 for a while and is struggling to find a stable support level. This declining trend led to a drop of over 7% in value over the past seven days, raising concerns among investors.
On the other hand, the Solana team released Mainnet Beta v1.18.15 to improve network performance and invited validators to update. This new version includes various fixes and introduces an optional centralized scheduler feature to address performance issues during network congestion. According to Solana Beach, a validator statistics page, more than 38% of validators on the network have transitioned to this update. Validators need to adopt this version as soon as possible to benefit from stability and performance improvements.
Such improvements in network performance are expected to support the price performance of SOL coin.

What Do Technical Indicators Say for SOL Coin?
The current market correction indicates that Solana could potentially surpass the resistance level at $160, reviving upward momentum. If SOL maintains this upward trajectory, it could rise towards $170, laying the groundwork for a potential approach to the $200 resistance level in the short term.
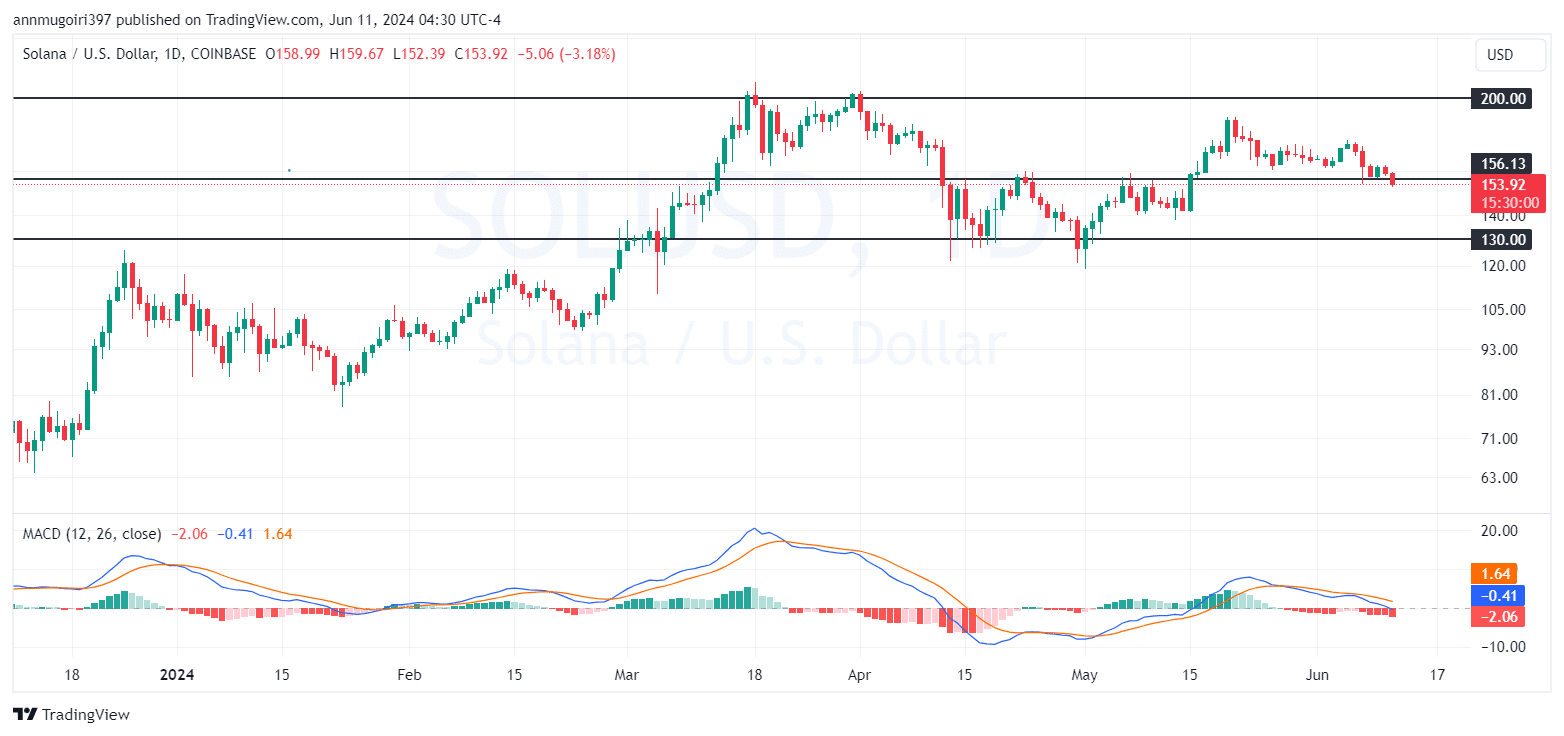
Conversely, if downward pressure continues, SOL’s price could drop to the support level at $140. If sellers dominate the market, the price could fall to the lower support region at $130, indicating a bearish trend in the market.
Technical indicators on the daily timeframe for Solana show a bearish trend. The Relative Strength Index (RSI) is at 41, approaching the oversold region. Additionally, the Moving Average Convergence Divergence (MACD) indicates a downward crossover with the MACD line at -0.42 and the signal line at 1.64, supporting the bearish momentum.
The Bollinger Bands on the daily chart reflect a bearish trend, with the upper band at $165 and the lower band at $154. Solana is trading slightly below the lower band, potentially indicating oversold conditions. This suggests that if buying pressure increases, the price could stabilize or recover.