Solana’s strength in this cycle is not limited to its price; data shows that other parts of the ecosystem continue to dominate the market. The observed recent process highlights a key area previously controlled by Ethereum in past bull markets. However, this time Solana is not only surpassing the blockchain network led by Vitalik Buterin, but another significant network is also getting involved.
What’s Happening on the Solana Front?
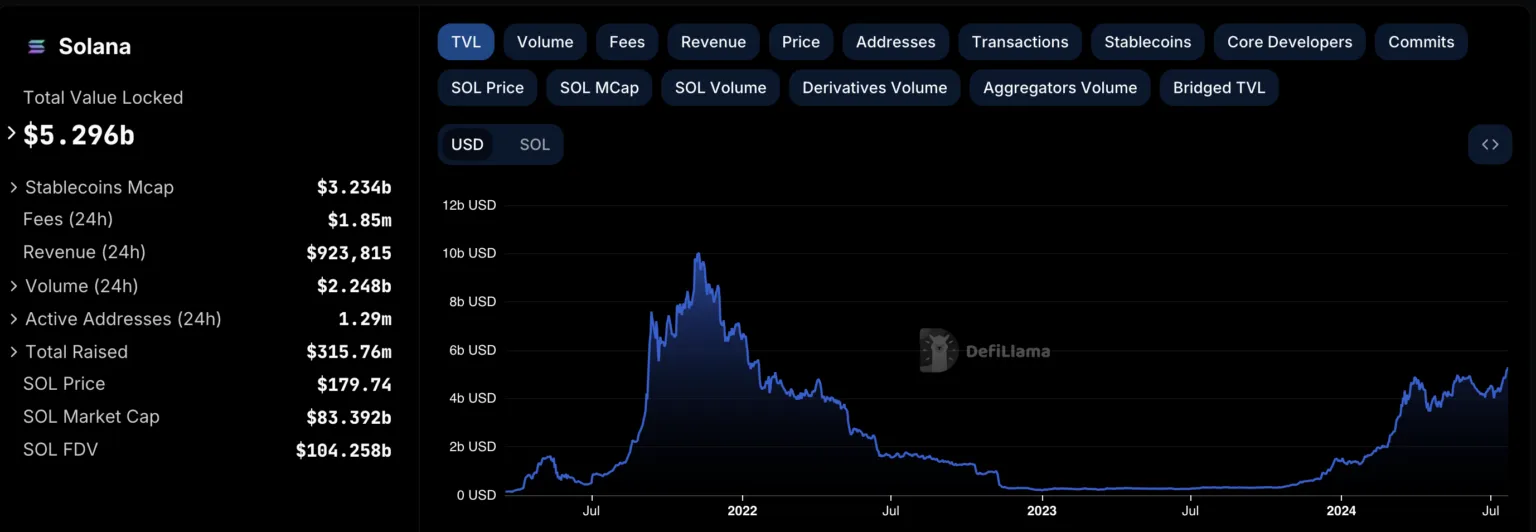
DeFiLlama data shows that Solana’s DEX volume in the last 24 hours was higher than the combined total of Ethereum and BNB Chain. Both Ethereum and BNB Chain recorded higher weekly increases, but this was not enough to keep Solana away from the top. As seen below, Solana’s DEX volume is $2.24 billion, while BNB Chain is $703.19 million, and Ethereum is $1.41 billion.

As a result of the increase, Solana currently holds about 36% of the total volume. The rise in data is linked to various reasons such as staking and the benefits of applications built on the chain. Notably, the increase in memecoin trading volume in the network’s decentralized applications is of great importance.
Throughout most of this market cycle, memecoin projects built on the Solana blockchain network have outperformed all other networks. Therefore, the demand for SOL and user activity reaches different peaks at different times. Additionally, data confirms that TVL has been on the rise since July 3, when the TVL data dropped.
TVL represents the value of assets locked or staked in a protocol and measures the health of a network. At the time of writing, Solana’s TVL value is $5.29 billion, which is above the high before the 2022 bear market began. The increase in this data means that market participants perceive the network as reliable. If the value of locked assets continues to rise, the same may be true for the SOL price.

SOL Chart Analysis
Between July 18 and 21, SOL formed four consecutive green candles, causing the price to rise to $185.21. According to our observations, the price increase helped the token form a double bottom pattern on the daily chart. Typically, this formation indicates the end of a downtrend, and with a neckline at $180.30, SOL’s price may be on an exit path.
If it continues, SOL’s price could increase by 13.05%. In such a case, the token could surpass the psychological level of $200 and reach $204.33. If market conditions become intensely bullish, the price could reach $210.11. These levels were last reached in March.


 Türkçe
 Español


