Solana price has been on a gradual increase since January 23, nearing its highest levels of 2023. While SOL has broken through a short-term resistance level, it is still trading below a long-term resistance level. We explore what might be expected for Solana in the coming period with detailed chart analyses.
Solana Weekly Chart Analysis
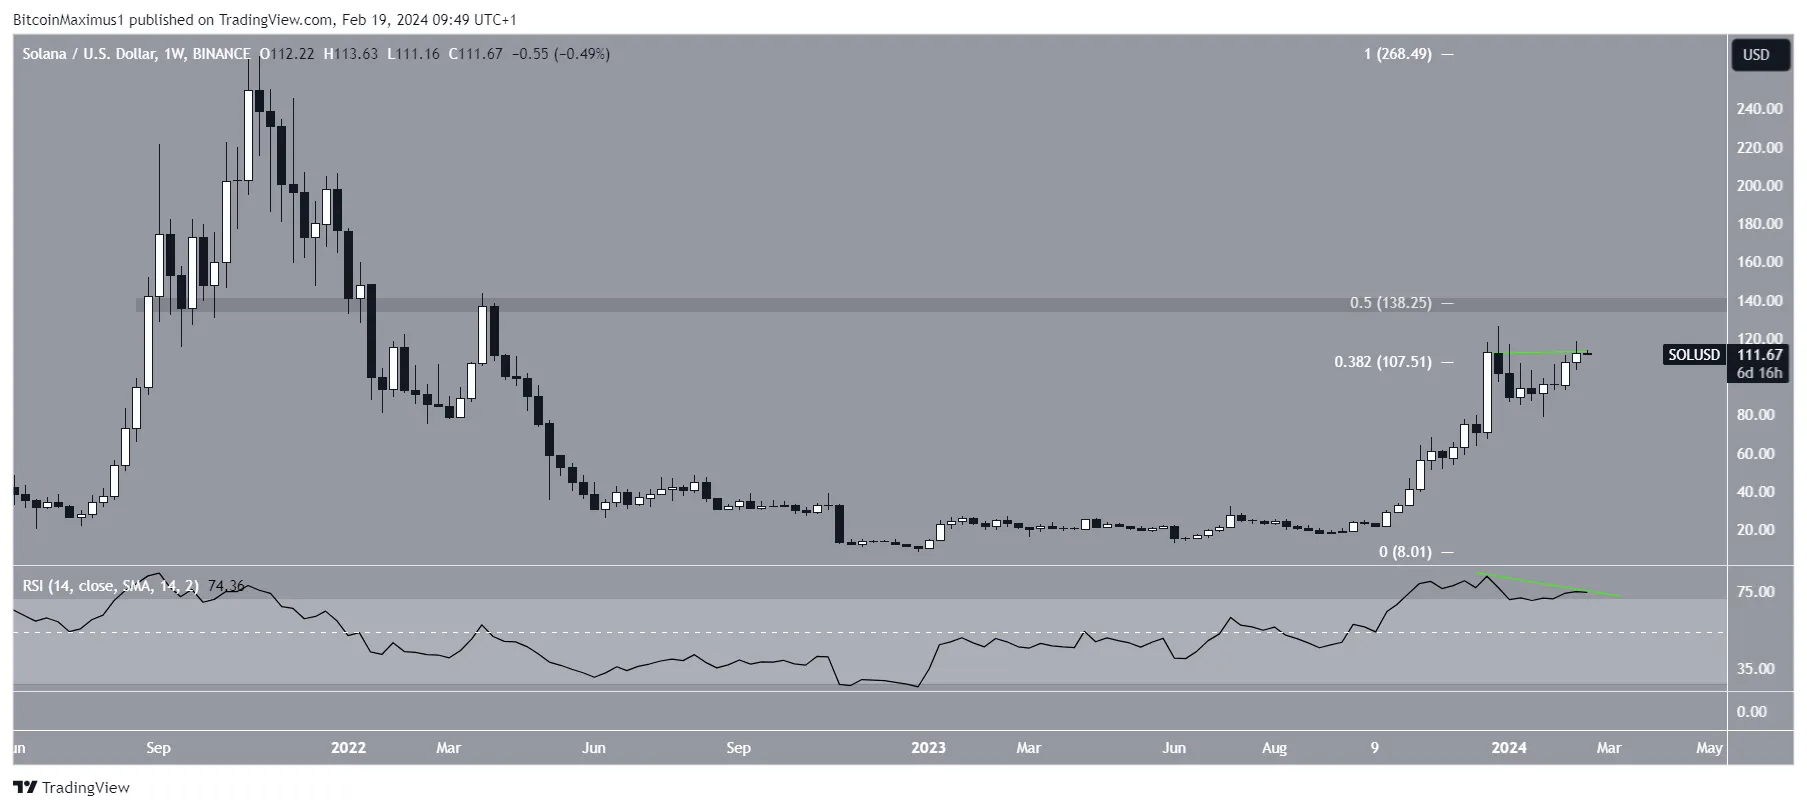
The weekly time frame technical analysis shows that SOL reached its highest level of 2023 in December at $126, but has declined since then. The decline dropped to $79 in January 2024.
Since then, SOL’s price has been rising, forming weekly bullish candlesticks. The price reached its peak at $119 on February 14, 2024. While the highest level occurred above the long-term Fibonacci retracement resistance level, SOL potentially formed a double top compared to its highest level in 2023. Crypto Traders Are Rushing to This App – Here’s Why You Should Too

The Weekly Relative Strength Index (RSI) also shows a declining trend. Market investors use the RSI level as a momentum indicator to determine overbought or oversold conditions. Readings above 50 and an upward trend indicate that investors are still at an advantage, while readings below 50 indicate the opposite.
Notable Analyst Comments on Solana
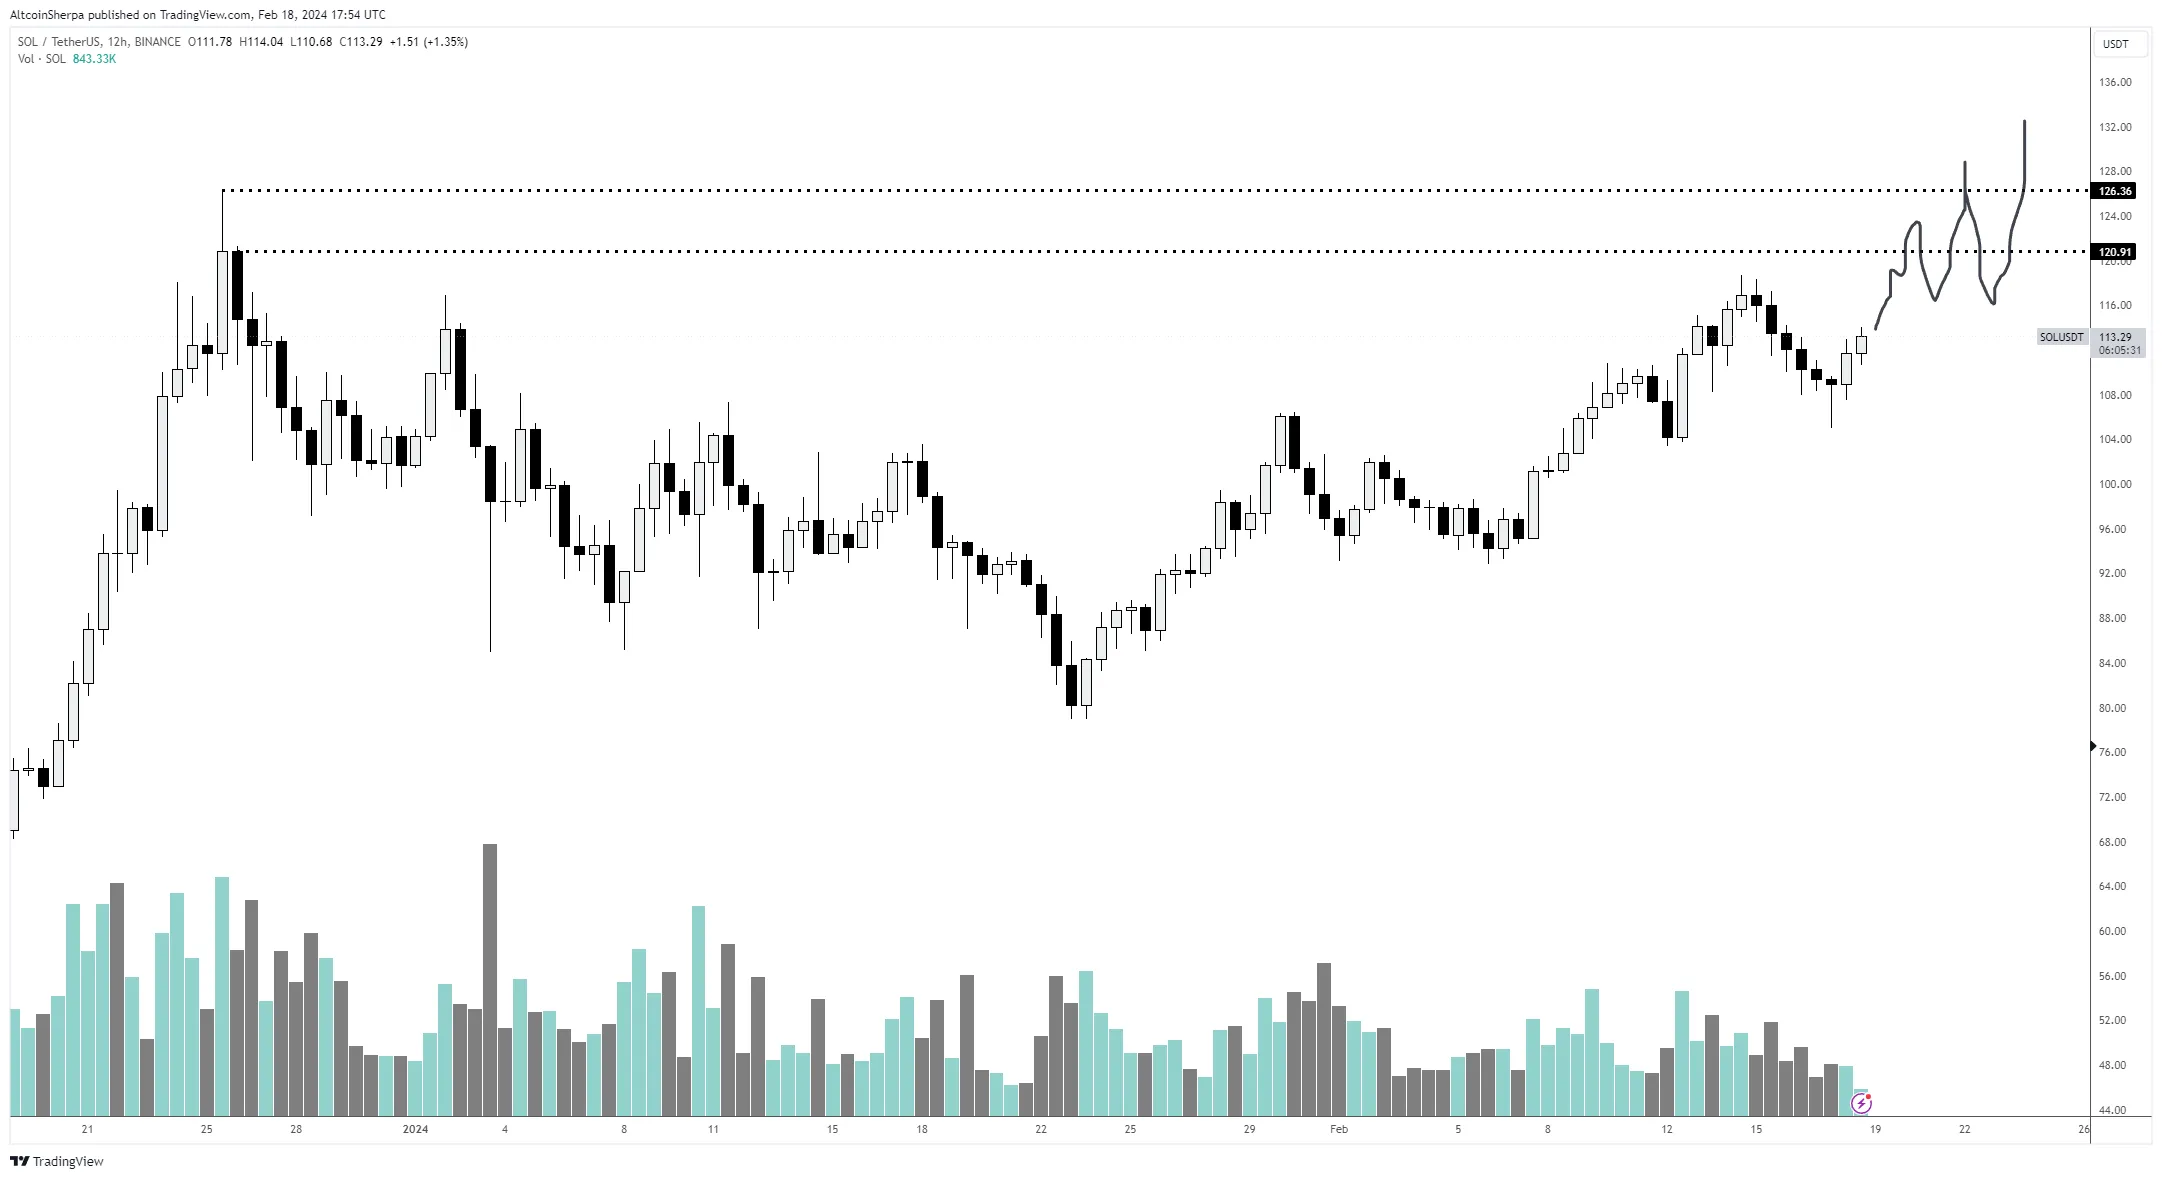
The indicator is forming a bearish divergence (green trend line) while increasing and being above 50, which usually precedes downward movements. Crypto investors and analysts sharing on platform X view the future SOL trend positively. Crypto investor Altcoin Sherpa also made notable comments about SOL:
“It’s strange to see it climbing slowly on the chart. Considering the length of time between each peak, I expect some kind of sell-off at the highs, but the overall market is still on the rise right now. I don’t think a major correction for Solana is on the table at the moment. I believe the uptrend will continue into 2024, and most people will make more money by just buying in now and sitting on it for months instead of waiting for a 20% correction.”


 Türkçe
 Español


