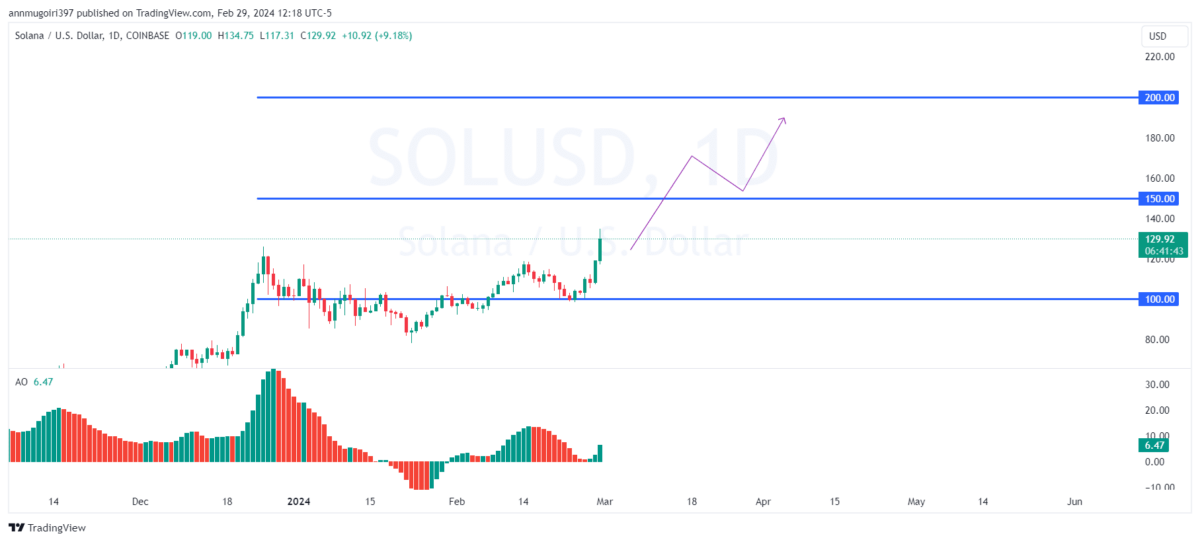
Solana (SOL) exhibited a strong upward trend in its chart with notable progress within the past day. Witnessing an impressive surge, Solana’s value increased by over 14%, reaching a new high for the year at $130. This increase could be part of a broader market rally led by Bitcoin, which surpassed $62,000.
Solana’s Trading Volume Rises
Solana’s trading volume surged by more than 127%, reaching $7.59 billion in 24 hours. This rise could indicate increased interest among analysts. With a market capitalization of $57 billion, Solana ranks fifth on CoinMarketCap. After trading within a narrow band between $100 and $110 for about a week, Solana’s market gained momentum. This momentum led to a breakout beyond the resistance level. Despite a brief 5.85% correction, the bulls quickly regained control and pushed the price up by 13%. Consequently, Solana surpassed the $125 resistance level, entering an uptrend.
Bitcoin has been at the forefront of the market rally, especially with the anticipated approval of spot Bitcoin exchange-traded funds (ETFs) on January 11. Expectations related to the Bitcoin halving have triggered strong surges in various cryptocurrencies. The recent peak prices of Solana are linked to the excitement surrounding Dogwifhat (WIF), a Solana-based meme token.

40% Increase in Total Value Locked (TVL)
The excitement around the meme token led to a 50% increase in its price from $0.52 on February 27 to $0.79. Since its launch on December 14, 2023, WIF has rapidly increased by over 374%. Solana’s ecosystem is evolving, and the total value locked (TVL) in its DeFi ecosystem has risen by 40% compared to last year, reaching $2.5 billion. This places it fourth in the industry, following Ethereum, Tron, and BNB.
SOL reclaimed the critical $130 level, laying the groundwork for future gains. If the upward momentum continues, there could be a move towards the $170 level on the horizon, potentially rising to $200. However, a possible pullback could cause prices to retreat to the $110 support level. The Relative Strength Index (RSI) is hovering just above 70, which could indicate overbought conditions alongside the uptrend. The Chaikin Money Flow (CMF) index at 0.21 points to a positive trend. Additionally, the placement of the 20 Exponential Moving Average (EMA) above the 50-EMA underscores the possibility of further gains.


