The price of Bitcoin is currently holding at $27,500, and the cumulative value of cryptocurrencies is at $1.09 trillion. The recently released ADP data was one of the best data in recent days. If the Non-Farm Payrolls data also comes out positive on Friday, altcoins could see a resurgence.
Stellar (XLM) Price Analysis
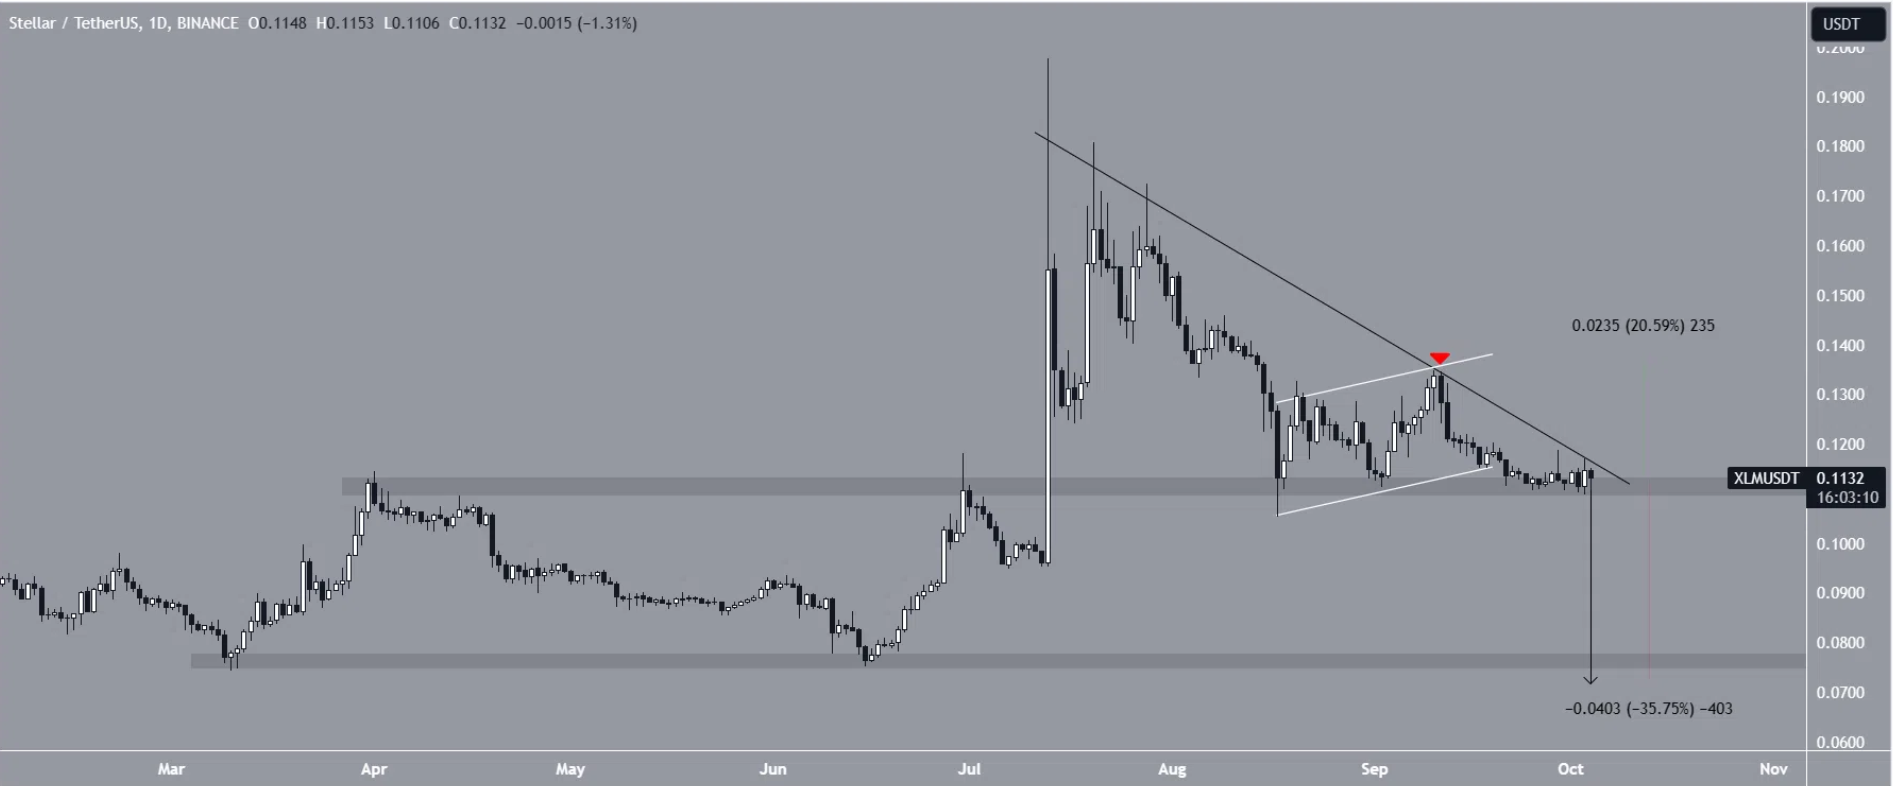
Stellar (XLM) price is currently at $0.1126. This level is close to the intersection point of the declining resistance trendline and the long-term horizontal support area. Although the support level has been maintained since April, the declining resistance has been in a downward trend for the past three months.
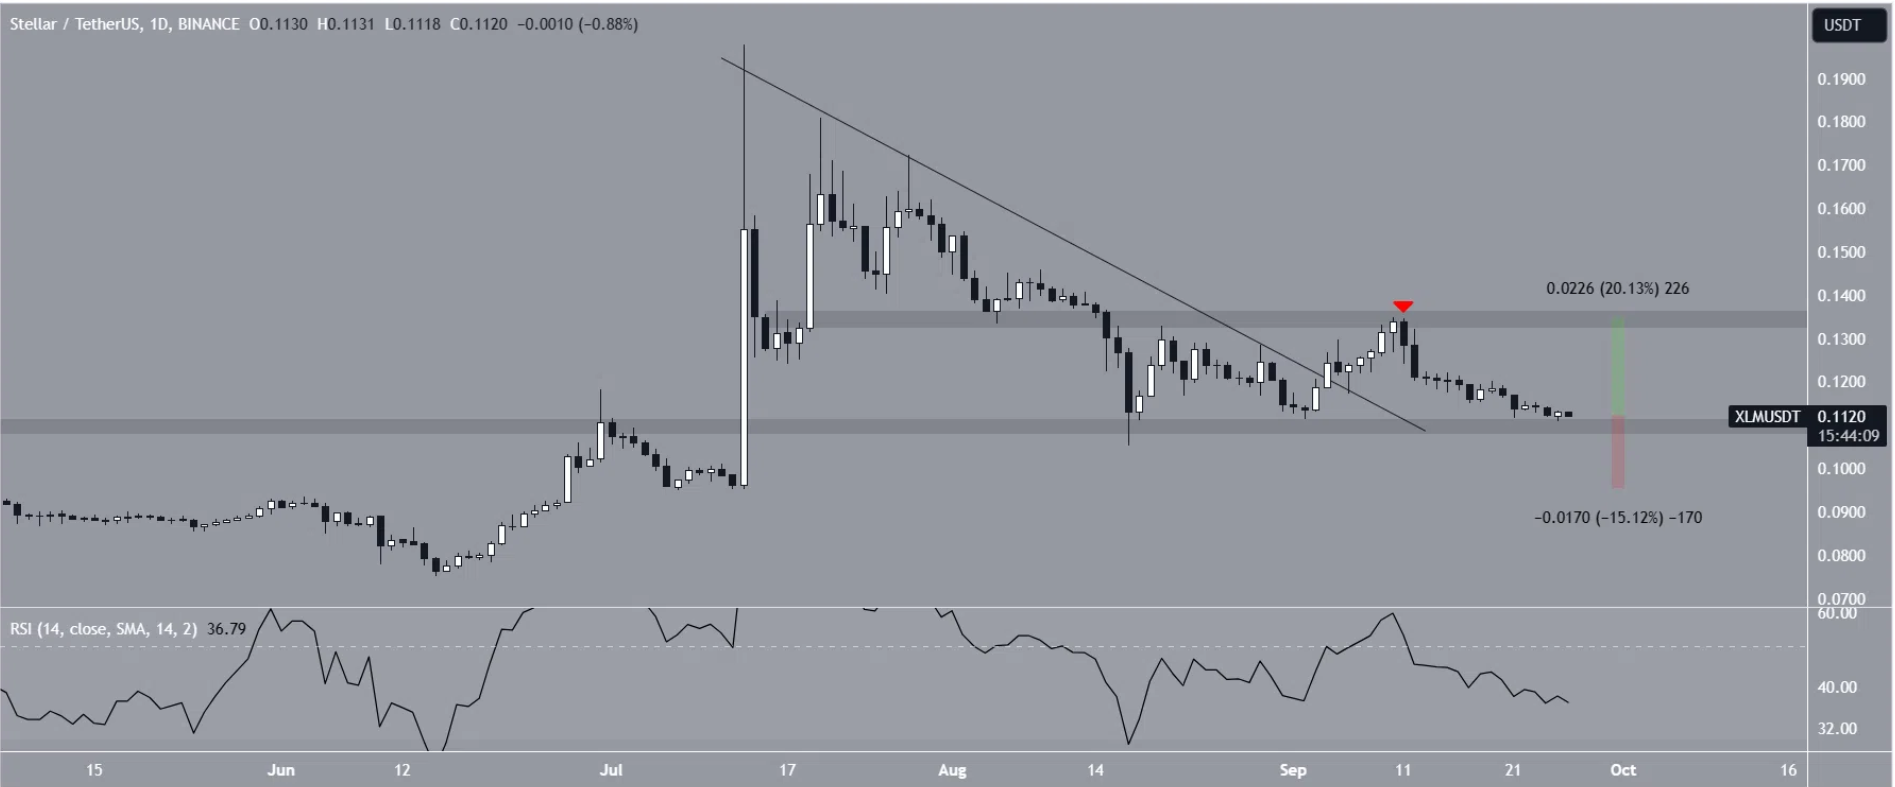
On the daily chart, the XLM Coin price fell below a declining resistance trendline on July 13. Approximately a month later, we saw the price drop to the $0.105 level. Despite the subsequent bounce, the XLM Coin bulls were unable to break out of the trendline. Instead, the decline continued along with rejection.

The XLM price is currently trading within the $0.110 horizontal support area. This level has been acting as both support and resistance since the beginning of the second quarter, making it an important area. Now, when we combine this level with the declining resistance trendline, an descending triangle formation is formed. This formation, which triggers downward movements, may indicate the end of months-long rally moves in price.
XLM Coin Price Predictions
Daily RSI readings are uncertain, and the possibility of a decline in Bitcoin price is becoming apparent. The rejection experienced by the king cryptocurrency at $28,500 implies that losses for altcoins could deepen in the short term at least. On the other hand, since the descending triangle is considered a bearish formation, a downward breakout could occur soon for XLM Coin.
The occurrence of an ascending parallel channel during the rise on August 17 also supports the bearish narrative. As with here, the rising price within the channel has the potential to break the base with the support of other factors.

The key area for XLM Coin investors is $0.11, and if there are closures below it, the downward momentum could gain traction. In the event of a possible decline scenario, the $0.076 horizontal support area could be tested. This represents a 35% loss from the current price.
For the sentiment of an uptrend to return, a breakout from the trendline should be observed. This could bring a rise to $0.14.


