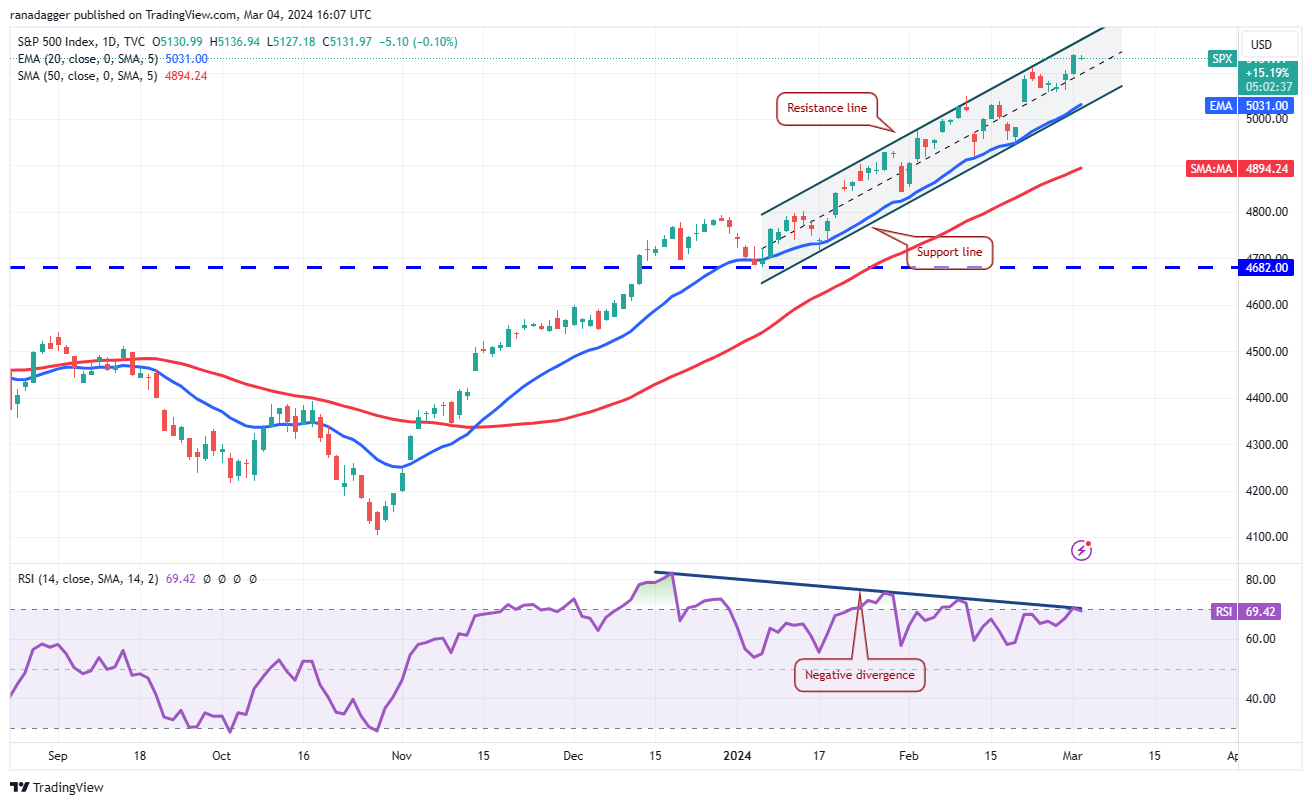
The S&P 500 Index (SPX) and Nasdaq reached all-time highs last week, indicating a strong appetite for risk among investors. Bitcoin does not want to be left behind and is currently trading just under $2,500 from its highest level reached in November 2021, which is $69,000.
S&P 500 Technical Analysis
The S&P 500 Index closed at an all-time high on March 1st, demonstrating solid investor engagement. The index has been trading within an ascending channel formation for days, suggesting that bears could mount a strong challenge at the resistance line. If the price falls below the resistance line, bears will try to pull the index down to the support line. A break below the channel could initiate a short-term correction phase.

Conversely, if bulls propel the price above the channel, it could signal a recovery in momentum. This could trigger a vertical rally, potentially taking the index to 5,300 and then 5,500. However, the negative divergence in the Relative Strength Index (RSI) suggests that bulls are losing strength, warranting caution from investors.
DXY Technical Analysis
Investors pushed the US Dollar Index (DXY) above the 20-day exponential moving average (EMA) of 104 on February 29th but failed to sustain it. Sellers pulled the price below the 20-day EMA on March 1st. The 20-day EMA has flattened, and the RSI is trading near the midpoint, indicating a possible range-bound action in the near term. If the price stays below the 20-day EMA, the index could move towards the 50-day simple moving average of 103, where buyers are expected to defend strongly.

On the flip side, if the price rises from the current level and breaks above 104.30, it could indicate strong buying at lower levels. The index could then climb to 105, and a break above this resistance could open the doors to a potential rise to 106.
Bitcoin Technical Analysis
Bitcoin has been on a strong uptrend over the past few days. Bears tried to halt the rise around $64,000, but this resulted in a flag formation. Bulls regained dominance after pushing the price above the flag on March 4th. This could mark the start of the next leg of the uptrend, potentially reaching the all-time high of $69,000 and possibly continuing to $76,000.

Time is running out for the bears. If they want to make a comeback, they need to quickly pull the price below $60,000. If they succeed, short-term traders could face significant losses, and the BTC/USDT pair could fall to the 20-day EMA average of $56,250.

 Türkçe
 Español


