In the world of cryptocurrency markets, we witness not only prices skyrocketing but also altcoins plunging by 99%. Even altcoins backed by major crypto companies have seen a 99% drop from their peak during bear markets. This downward trend can continue steadily, as exemplified by SUI Coin.
SUI Coin Analysis
SUI Coin, which angered the community during the airdrop period, quickly got listed on popular exchanges. Investors expected it to bring significant gains like APT and SOL, but as network activity declined, the price dropped. Furthermore, concerns about supply added to the decline, bringing the price to its current levels.

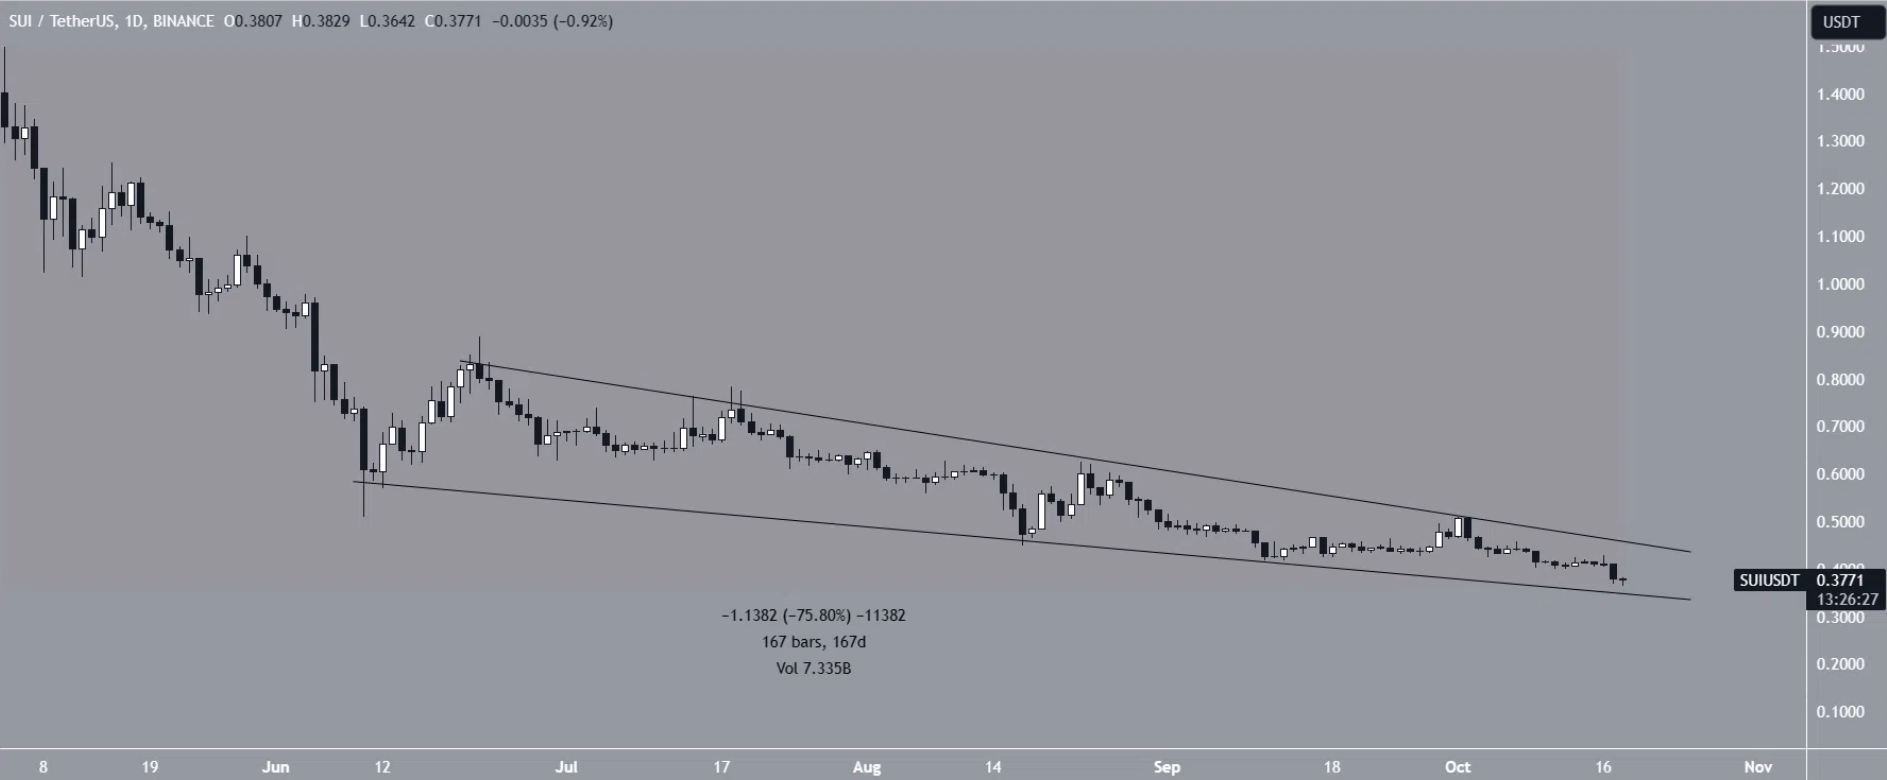
On May 4th, SUI Coin reached $1.5, setting its all-time high (ATH), but within 167 days, it has decreased by 76%. Today, it has hit a new historical low of $0.36. Investors initially expected this newly launched altcoin to reach even greater heights this year, but it chose to experience consistent declines after a feeble start.
Since June 10th, there has been a gradual decline, and the price has been within a descending wedge pattern, which is considered a bullish formation.
SUI Coin Price Prediction
A significant contradiction stands out for this altcoin, which has set its all-time low (ATL) today. The total locked value (TVL) on the network reached its historical peak during the same period. It was surprising to see the price hit rock bottom while the locked supply had reached $59.
On October 17th, the SUI Foundation responded to long-standing allegations. These allegations revolved around the circulation supply being shown lower than normal and the locked supply being directed for sale. The Foundation dismissed these reports as false and urged the public to verify themselves by looking at the blockchain data. The Foundation also mentioned that more than $1 million grants were given to 15 projects in the DeFi sector. However, these actions have not completely alleviated public concerns.

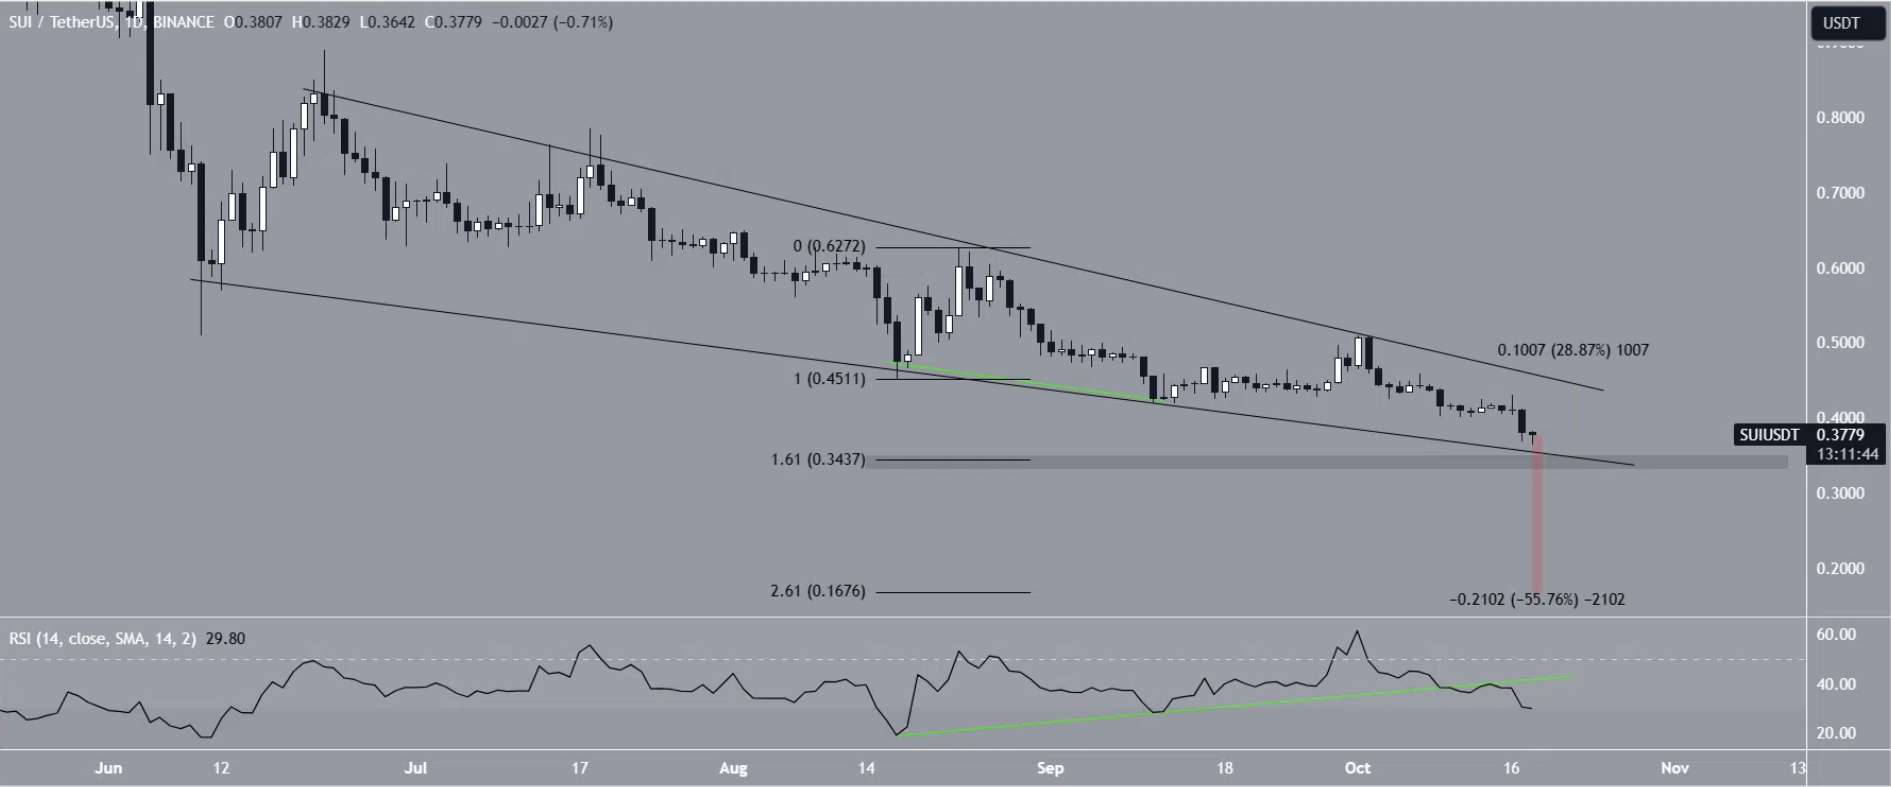
Looking at the price, the RSI indicates that the selling pressure may continue. Since the price is already at its bottom, possible supports can be identified using the Fibonacci levels, which point to $0.34 and $0.3. However, if the price unexpectedly bounces back from the $0.34 support, it could rise up to $0.45. This area acts as a resistance level and could reverse the downtrend.
The ultimate bottom could be $0.16, depending on convincing support breakouts.

 Türkçe
 Español


