Technical analysis is a crucial indicator that investors trading in the futures market, especially, need to continuously follow in the cryptocurrency market. So, what does technical analysis tell us about Dogecoin, which is currently trading at $0.07548? Let’s examine the detailed chart analysis along with the important support and resistance levels.
Four-Hour Chart Analysis of Dogecoin
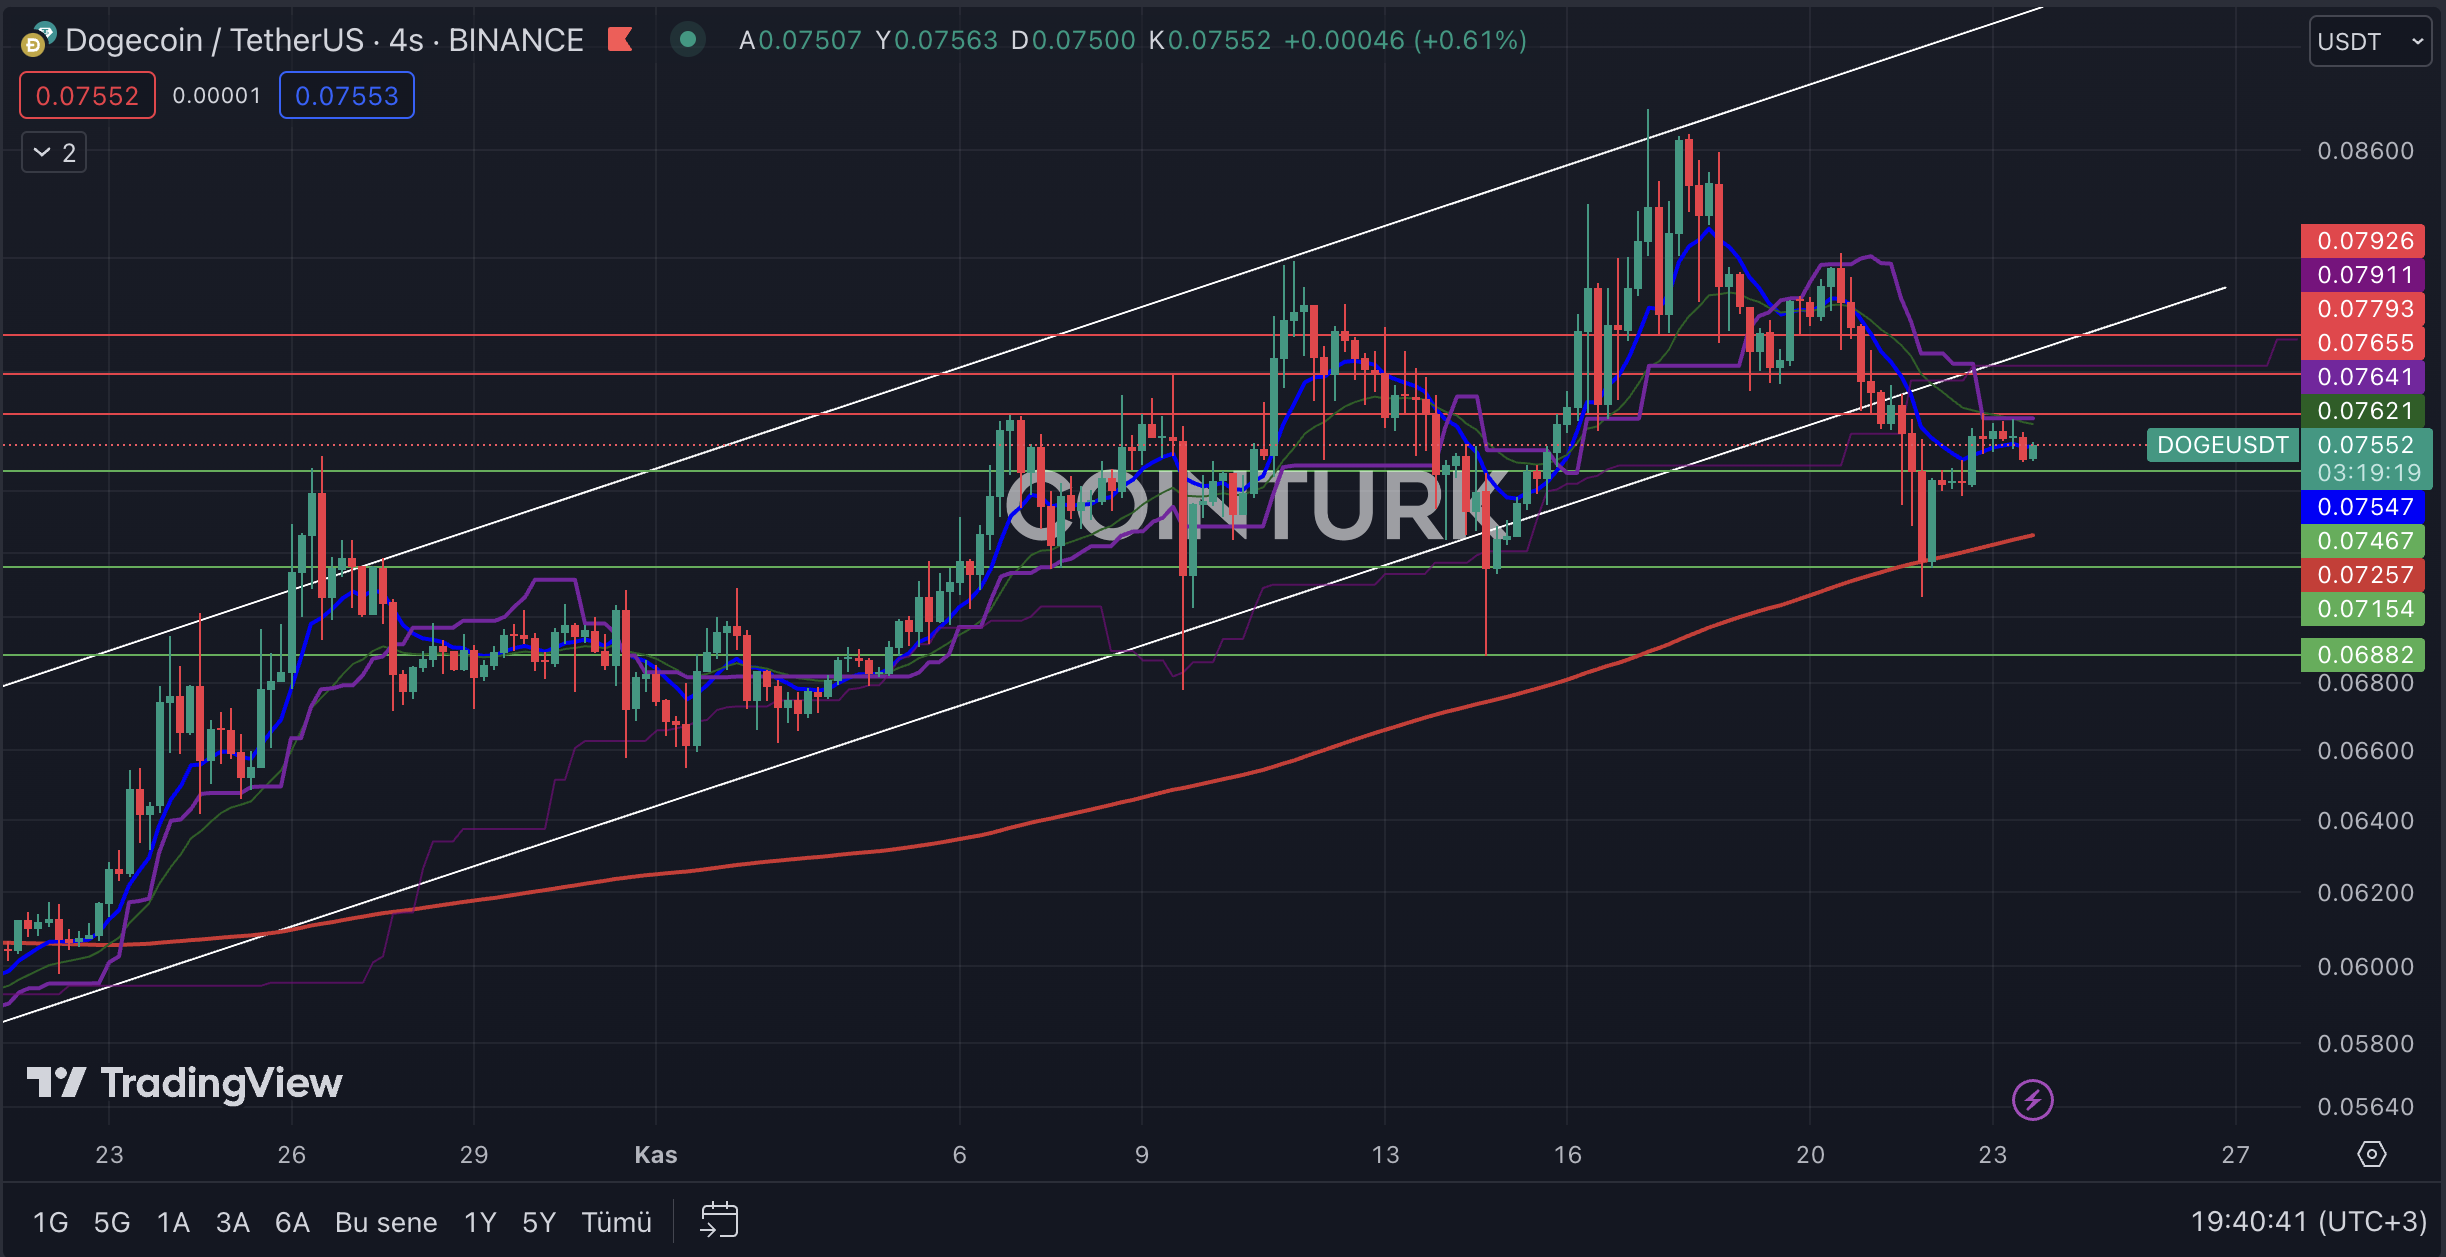
The four-hour chart analysis for Dogecoin shows a continuing anxious wait. According to this, DOGE, which experienced a support break after the correction that occurred on November 21 in the rising channel formation, has not yet entered the formation zone, despite completing its correction movement after finding support at the EMA 200 (red line) level. This situation is particularly important for short-term investors trading in the futures market.
The most important support levels to be followed for Dogecoin are respectively; $0.07467, $0.07154, and $0.06882. Especially for DOGE, which is trapped in a narrow range, if the four-hour bar closes below the $0.07467 level, it will cause the price to lose momentum again. After this process, the bar closure below the $0.07154 level, which intersects with the EMA 200 level, is the most important level that investors need to pay attention to.
The most important resistance levels to be considered in the four-hour chart for Dogecoin are respectively; $0.07655, $0.07793, and $0.07926. Especially, if the four-hour bar closes above the $0.07793 level, it will help DOGE re-enter the formation zone and gain momentum.

Weekly Chart Analysis of Dogecoin
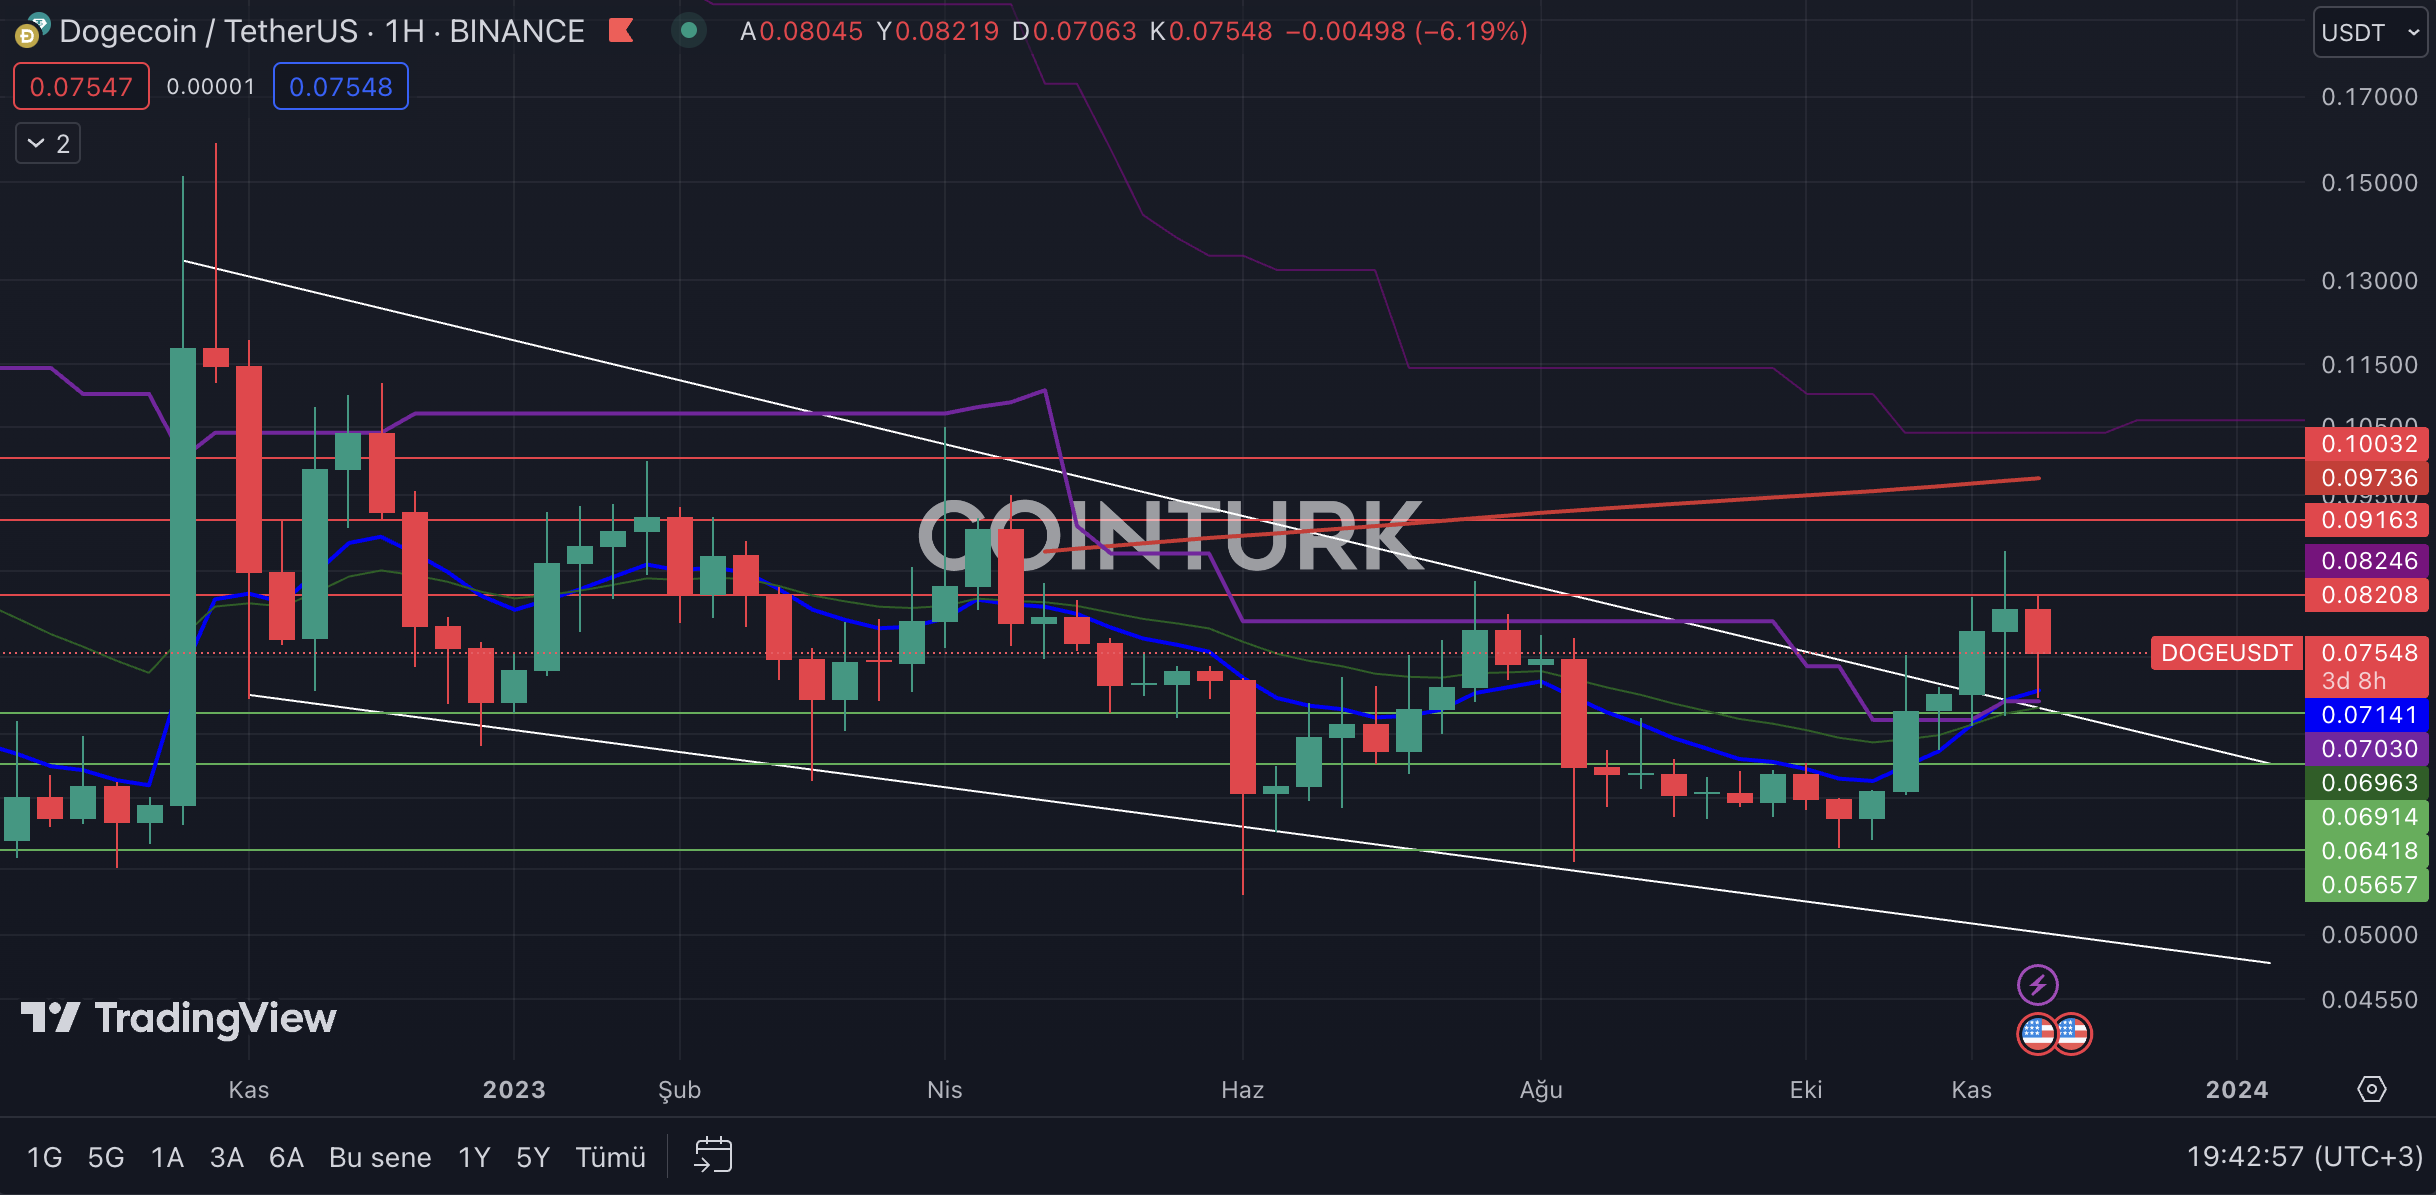
In the weekly chart analysis of Dogecoin, there is a narrowing channel formation that has been developing since November 2022. With the recent uptrend, DOGE managed to break the resistance line in this formation structure, and we saw that the resistance line worked as support during the correction that occurred this week. Such breakouts successfully attract the attention of investors in both the cryptocurrency market and traditional markets in terms of technical analysis.
The most important support levels to be followed in the weekly chart for DOGE are respectively; $0.06914, $0.06418, and $0.05657. Especially, if the weekly bar closes below the $0.06914 level, it will cause the DOGE price to lose momentum.
The most important resistance levels to be considered in the weekly chart for DOGE are respectively; $0.08208, $0.09163, and $0.10032. Especially, if the weekly bar closes above the $0.10032 level, it will lead to the breakage of the EMA 200 level and the price gaining momentum.


 Türkçe
 Español


