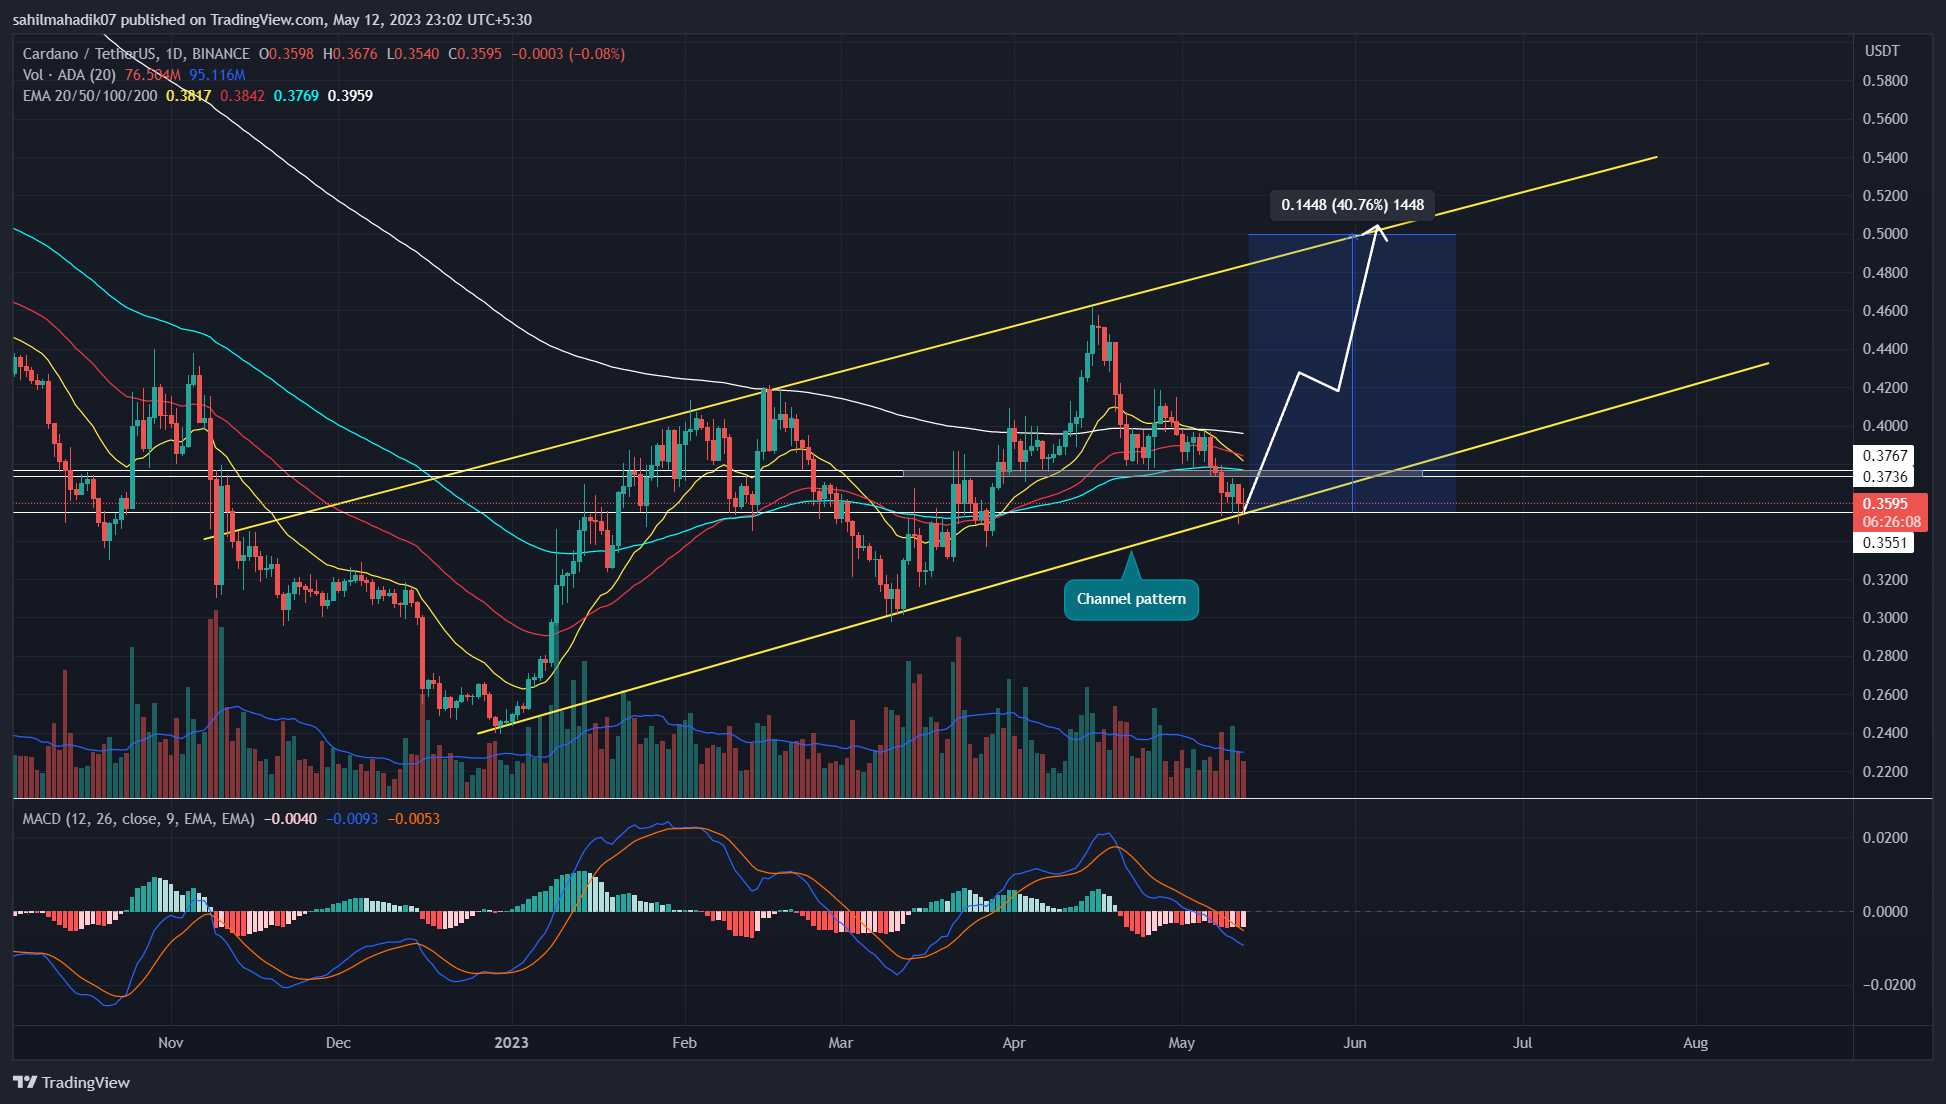
Amid the recent decline in the overall cryptocurrency market, Cardano‘s (ADA) price was seen falling back to the $0.35 support, where it has been falling for nearly a month. However, the daily chart shows that the aforementioned support is also aligned with the lower trendline of the channel pattern. This pattern had previously triggered a great rally to the upper resistance line of the channel, where ADA staged a recovery rally for nearly four months. Here’s how this pattern could affect ADA’s future trends.
Cardano Price Analysis

While the cryptocurrency market has been facing significant sell-off over the past few days, Cardano price has been moving sideways above the support trendline of the channel pattern. Amidst this accumulation, ADA price lit several bearish price rejection candles, indicating that sellers’ attempts to break through the support trendline failed.
These rejection candles reflect a higher probability of bearish reversal at the channel support. However, for a better confirmation of a bearish to bullish reversal, popular altcoin price needs to break through the first resistance at $0.376-0.373 shown in the chart above. A daily candle close above this hurdle would present a real buying opportunity for traders interested in ADA.
In the ideal scenario, the channel is expected to make a reversal from the support trend line and rally towards the resistance line. In this scenario, the ADA price would have a potential rally of about 40 percent to reach the $0.5 level. In the opposite scenario, the price may fail to break below the support trend line, fail to rally, and fall.
Technical Indicator for ADA
The Moving Average Convergence Divergence (MACD) (blue) and a signal falling into bearish territory (orange) reflect a sustained bear trend. The 100-day Exponential Moving Average (EMA) is moving around $0.376, which increases the importance of this level.


I need to chain my coin market cap@