Following the recent crash in the altcoin market, several cryptocurrencies began trading at significantly discounted prices, potentially offering substantial profit opportunities for interested investors. Here are three altcoins that have reached significant support levels and demonstrate strong bullish potential in the light of technical analysis.
Zilliqa (ZIL) Price Analysis: Awaiting Bottom Fishers
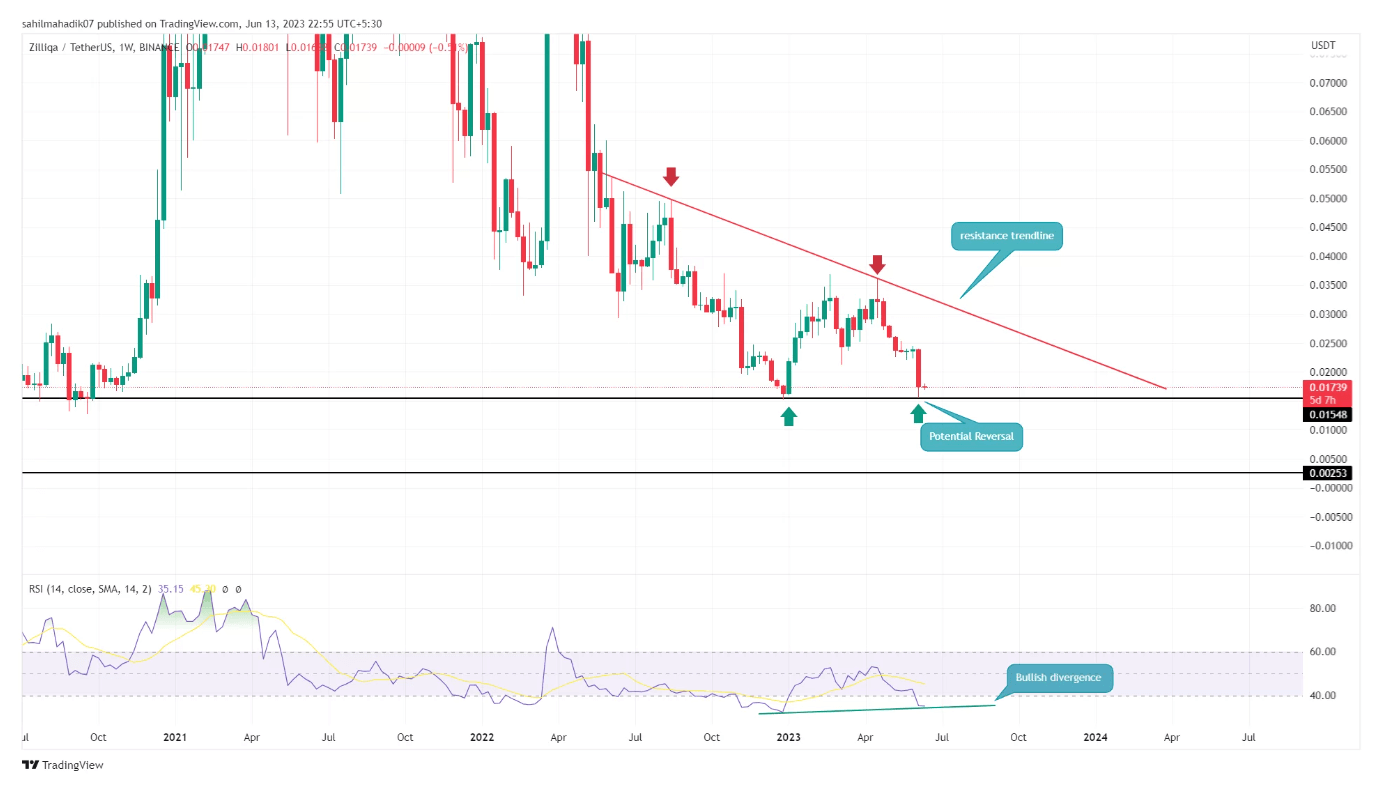
Amid the increasing selling pressure in the cryptocurrency market, Zilliqa‘s price plunged to as low as $0.0155 in the monthly timeframe. The elongated price rejection candlestick seen in the daily chart suggests that buyers have begun to accumulate at this support level, indicating potential reversal to bullish sentiment. The weekly Relative Strength Index (RSI) tilt is slightly upwards, instilling additional confidence in buyers by pointing to the underlying bullish momentum. However, the technical chart highlights the falling trend resistance line that has been thwarting buyers’ control for the past 10 months.

Considering this, investors seeking a safer entry level in this altcoin might want to wait for a breakout above the falling trend resistance line. A rally initiated post-breakout could drive ZIL‘s price to the psychological level of $0.05.
Stacks (STX) Price Analysis: Holding at a Key Support Level
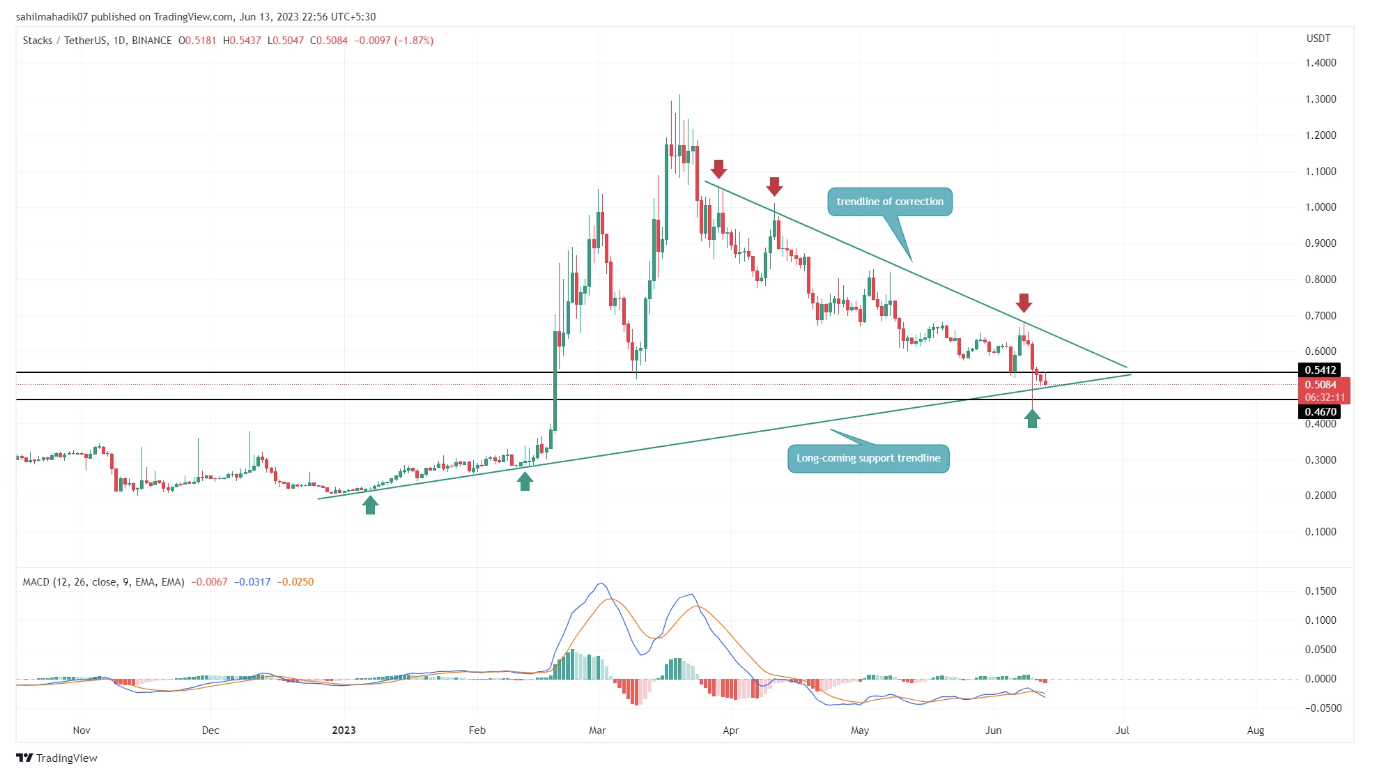
Stacks‘ price rose on June 10th, drawing attention with a long-wick rejection candle at the rising trend support line and the combined support at $0.467. This candlestick indicates that buyers were able to offset most of the day’s losses and strongly defended the mentioned support level.
With STX trading at a 1.68% intraday decline, the sustainability of the price above the trend support line may need to be confirmed by a retest of the general trend support. A return from this support level could bolster the price’s ability to break and exceed the falling trend resistance line.

A break above the falling trend resistance line will serve as an early and leading indicator of a reversal from a downtrend to an uptrend, and the Stacks price can move towards the $1 level.
MultiversX (EGLD) Price Analysis: Bullish Formation in Progress
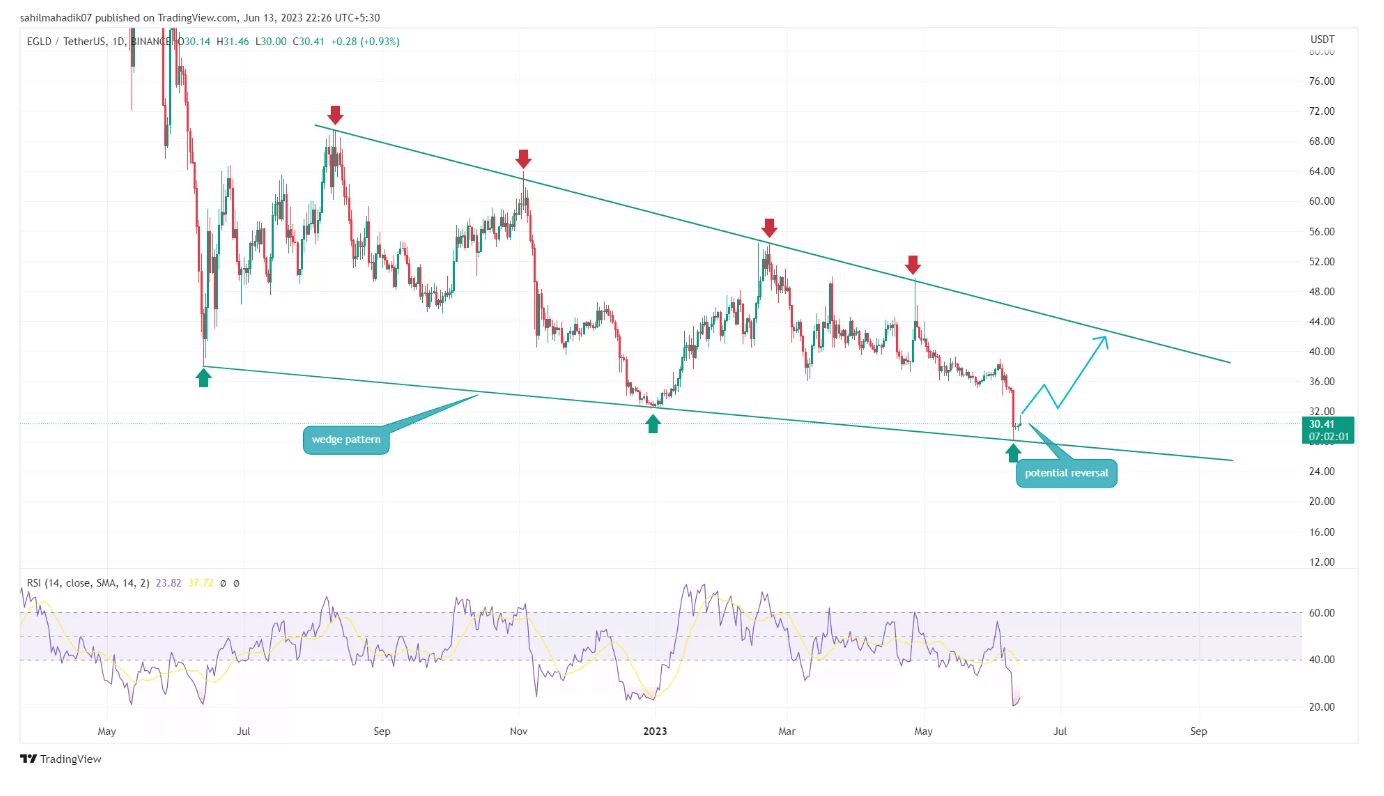
The MultiversX price on the daily chart clearly demonstrates a descending wedge pattern, seemingly taken straight out of a textbook page. Theoretically, this pattern presents a well-known continuation of the bull run for investors when the general trend line is crossed.

EGLD‘s price has fallen to the lower trend line of the formation due to the recent market-wide selling pressure. The candlestick reflecting price rejection at this support level, combined with the oversold signal from the momentum indicator, suggests a potential reversal to bullish sentiment. Such a reversal could initiate a bull cycle within the formation, propelling MultiversX towards its first target of $40, thereby triggering a break above the general trend line.


