The leading cryptocurrency, Bitcoin (BTC), has seen a rise compared to the last two days, reflecting positively on the general market and altcoins. Tron (TRX) is one of the altcoins that gained in the past seven days.
Bulls Fight in TRON
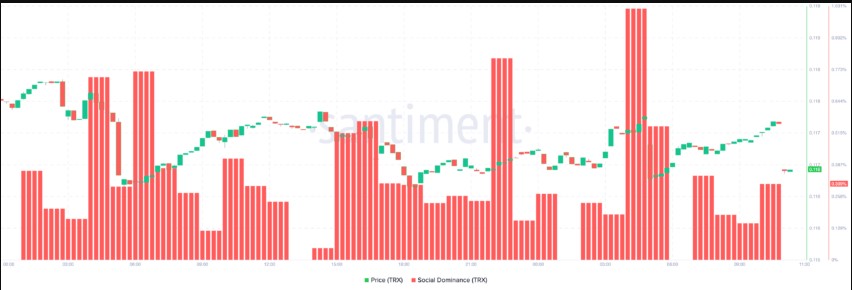
Since its drop from the $0.12 level last May, TRX bulls have tried to prevent the price from falling below the $0.11 support. Data from the cryptocurrency analytics company Santiment shows that Tron’s social dominance, an important metric, is progressing positively. This metric represents the share of discussions about a specific token in crypto media.
When this ratio increases, a general upward momentum can be seen in the mentioned altcoins. Conversely, a decrease in the metric may mean the altcoin is less recognized in crypto media. The rising dominance has also reflected on the TRX price, which could indicate increased demand for the token. However, it is important to evaluate the price potential technically.
On the daily chart, TRX might face selling pressure from mid-May to May 28. During this period, the cryptocurrency’s price fell from $0.13 to $0.11. Bears tried to push the price down further. However, the strong stance of the bulls and the reduction in selling activity by sellers might render this effort insignificant.

Resistance Level in TRX
However, Tron’s price has started an upward movement since the mentioned period. From May 28 to June 11, it formed an ascending channel. On one side, the trend line shows support by creating a higher low point. On the other side, the trend line may form a higher peak representing resistance.
MACD is a technical indicator that determines whether a cryptocurrency’s momentum is bullish or bearish. Positive data in the metric indicates an upward trend. Conversely, a negative reading indicates a downward trend.


