The founder of one of the most controversial cryptocurrencies, Tron (TRX), and the price of Bitcoin indicate that selling pressure could accelerate in the market. On the other hand, technical analysis readings for Tron suggest a sharp decline. So, what critical levels should TRX coin investors be aware of in the coming days?
Tron (TRX) Analysis
The price of TRX coin is currently finding buyers at $0.773. Meanwhile, Bitcoin failed to hold the critical level of $29,500. On the other hand, there is an important FUD circulating about Huobi and Justin Sun related to TRX coin. According to allegations, Sun is using the assets of Huobi exchange customers in his trading operations. However, even if Sun’s entire balance is transferred to the exchange, the reserve cannot reach 100% coverage. Moreover, the fact that customer assets can be arbitrarily moved under the control of the exchange owner reminds investors of the FTX-SBF duo. This is worrisome.
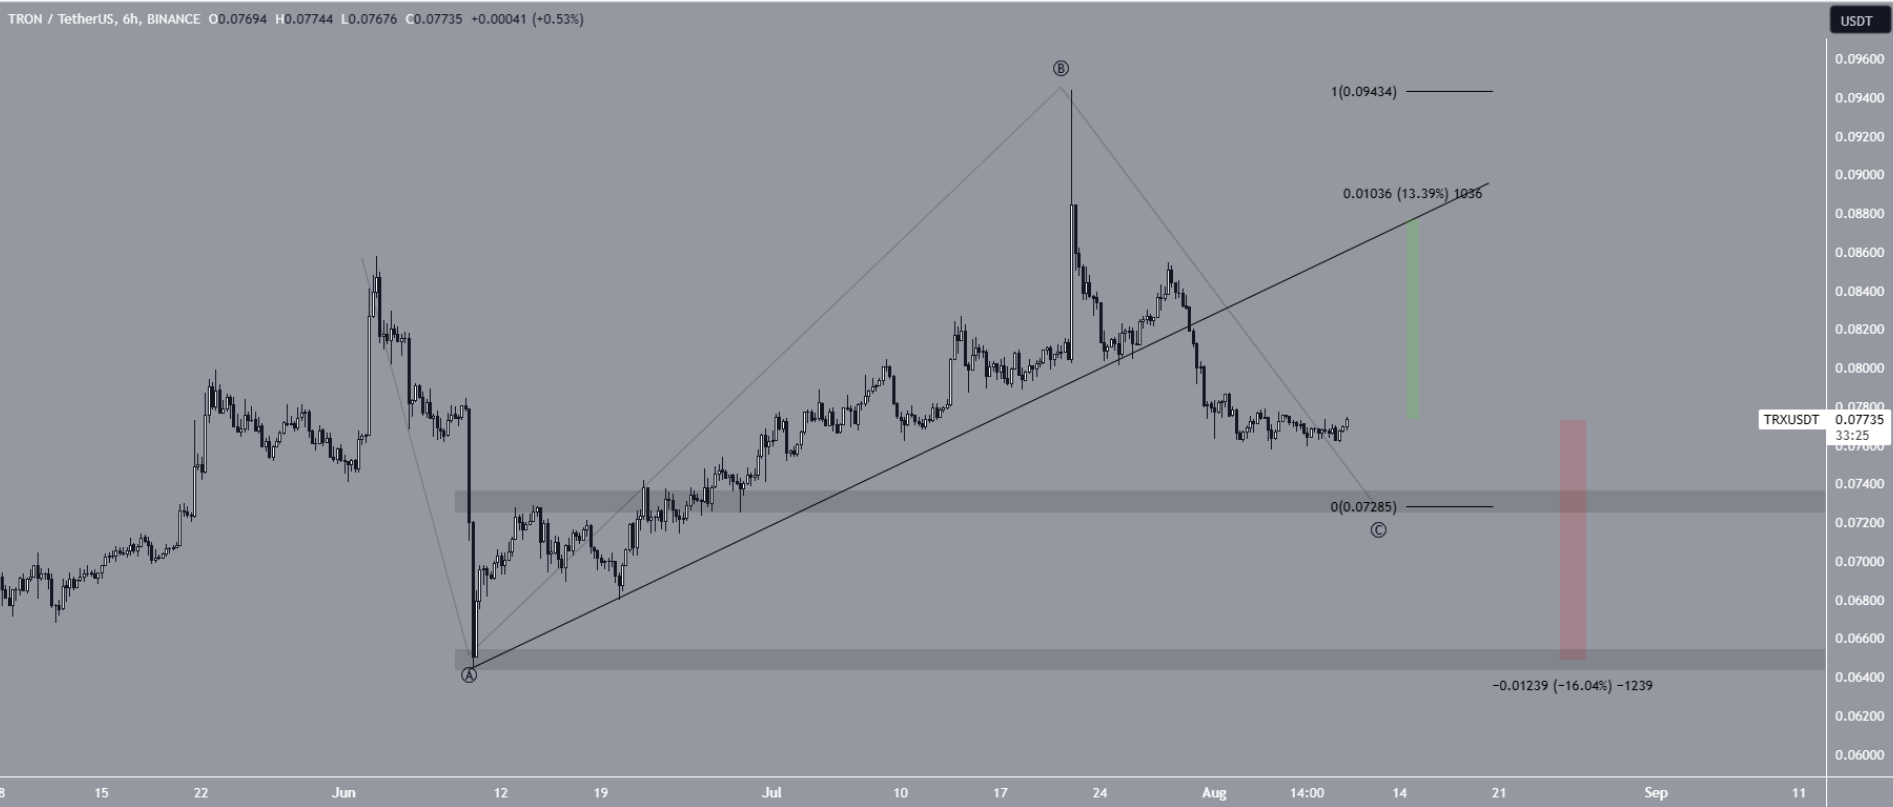
Regarding the price of TRX coin, it has been declining since July 22 and recently broke below the short-term rising support line. The downward values coming from the daily and six-hour timeframes are considered a bearish trend.

So, let’s examine the critical levels and potential price targets. How low can the TRX coin price drop?
TRX Coin Chart Analysis
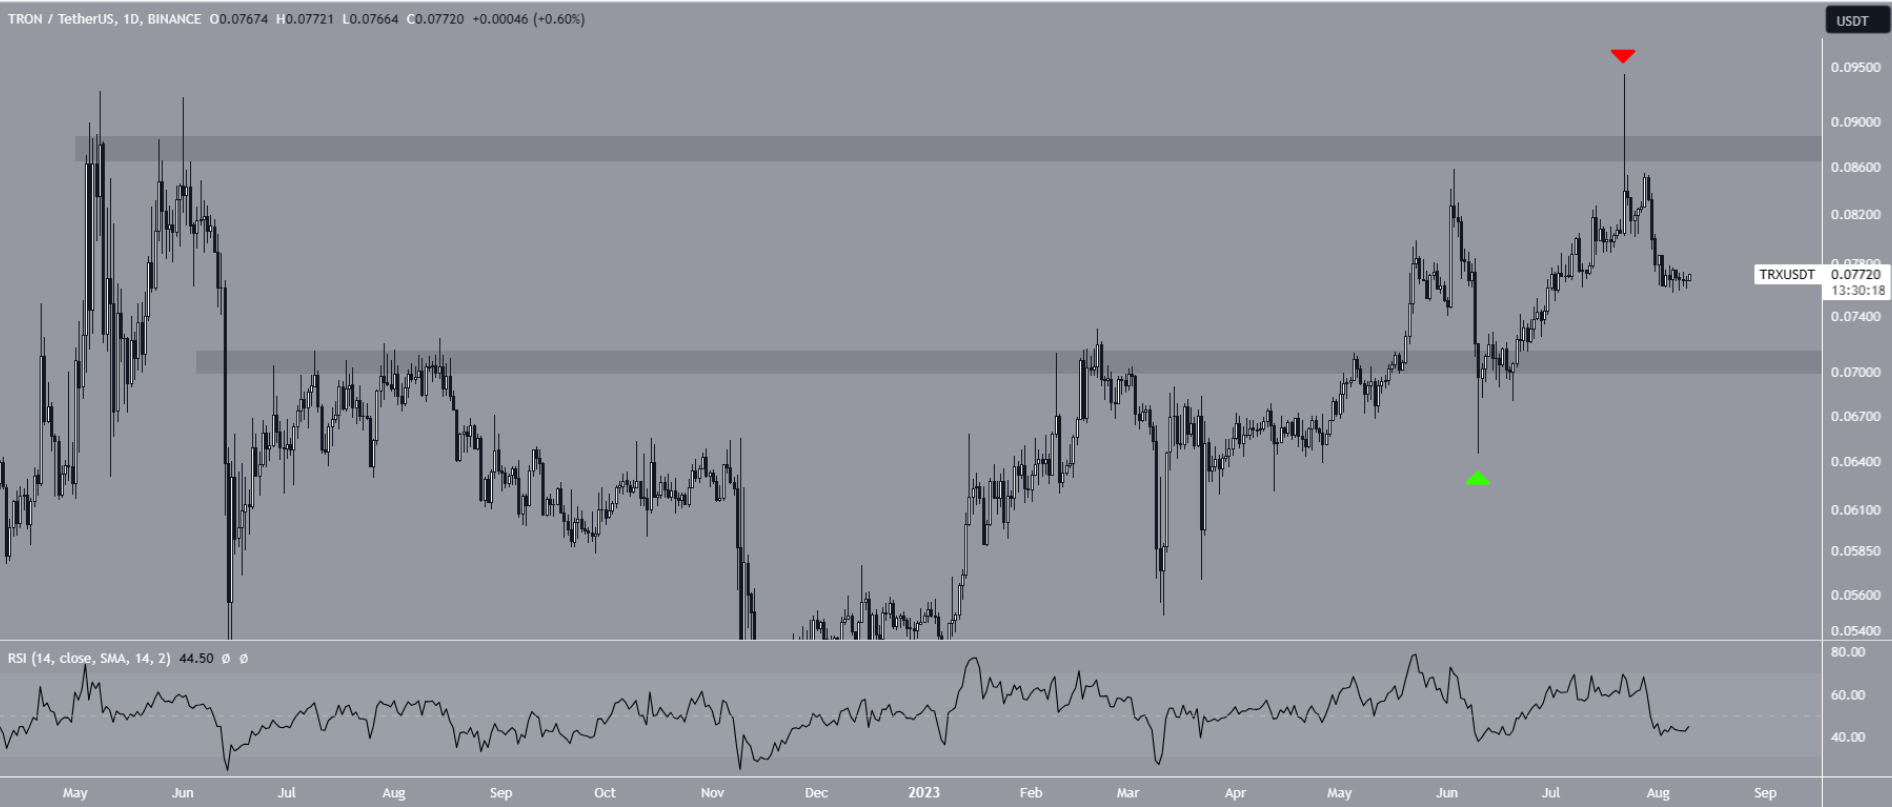
Since May 20, the popular altcoin has been trading between $0.070 and $0.088. The price started its upward movement on June 10. At that time, TRX initially retraced to the horizontal support area of $0.070. However, it quickly formed a long lower wick, avoiding a potential breakdown.
On July 22, the price reached $0.094, the highest level of the year, and it seemed to have broken above $0.088. However, it turned out to be the opposite of June. Similarly, the six-hour timeframe suggests that the price could make a deep dip before starting an upward movement.

The main reason for this is the breakdown of the rising support line that has been in place since June 9. This coincides with the time when the TRON network celebrated its fifth anniversary of the Mainnet version. This indicates the end of the previous upward movement and the start of a new movement in the opposite direction. Moreover, the increase next to the rising support line appears to be a bearish signal due to significant overlap.
The Elliott Wave Theory suggests that the B wave is in a corrective structure of A-B-C. If so, the TRX price is currently in the C wave. Therefore, the price could test the $0.072 support. If the support is lost, we could see a price decline of about 20% towards $0.066.

 Türkçe
 Español


