Cryptocurrency world witnessed a significant development today from Uniswap. The decentralized cryptocurrency exchange Uniswap has launched its V2 version on six chains. Available on chains such as Arbitrum, Polygon, Optimism, Base, Binance Smart Chain, and Avalanche, Uniswap V2 enables users to swap their assets through a single interface. This step indicates a growing and diversifying ecosystem in the crypto world.
The transition to the V2 version on UNI signifies an increased potential for Uniswap. This is because V2 pools provide users with access to more liquidity, allowing them to trade more effectively in the market. Despite the advanced capabilities offered by V3, Uniswap revealed that users prefer V2 due to its simplicity and ease of use.
Development Does Not Reflect on UNI Price
Considering the current market conditions, the recent decline in UNI’s price is noteworthy. UNI, which has fallen by 4% to a level of $7,209 today, might have unsettled investors. However, on-chain measurements suggest that the price drop could be temporary and that UNI may revisit its 2024 peak of $7,972.

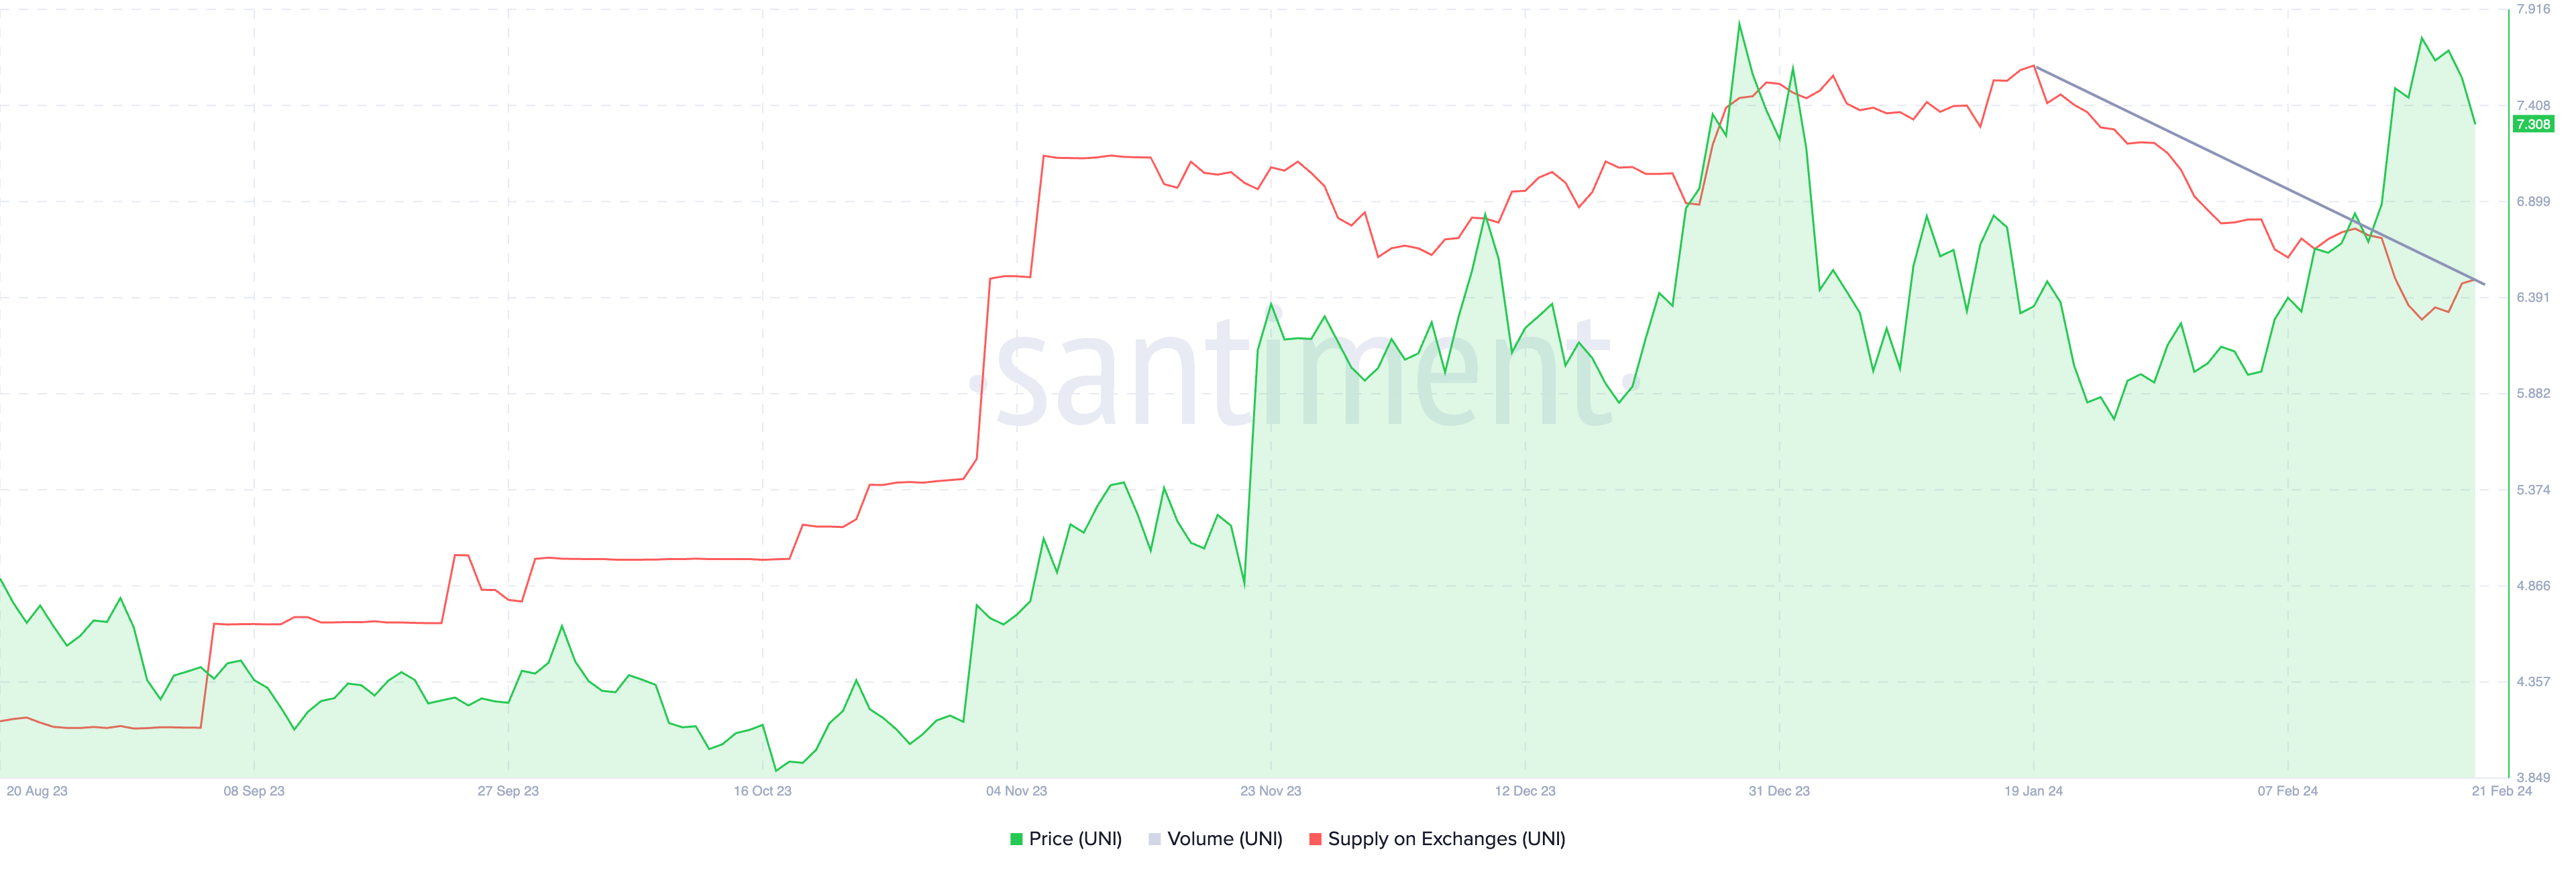
Looking at the on-chain measurements, the supply data from exchanges indicates a decrease in UNI reserves across exchange platforms. The supply of UNI dropped from 70.59 million on January 19 to 67.9 million on February 21. Generally, a lower supply on exchanges is considered a bullish sign as it implies that investors are holding the token in their wallets, thus reducing the likelihood of selling.
What Do the Metrics Say?
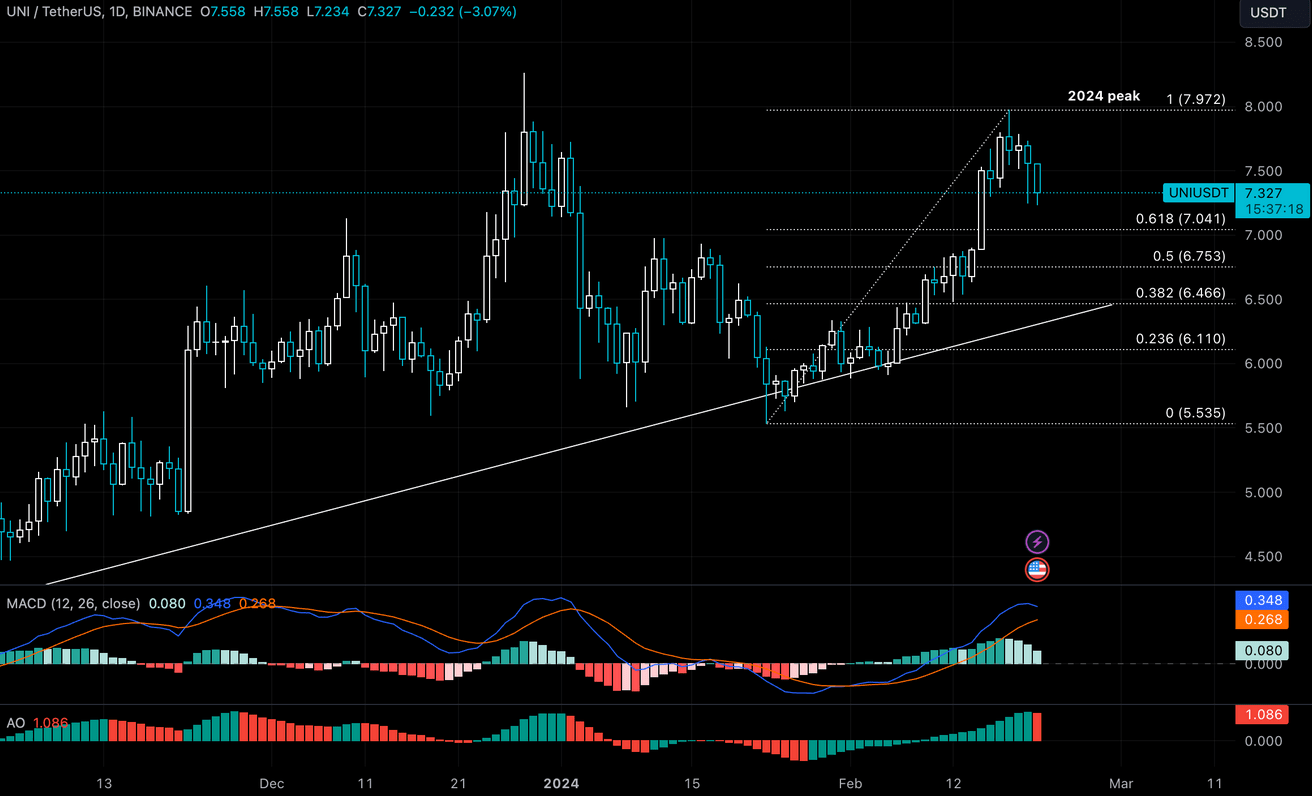
Looking at the technical analyses related to UNI’s price movements, various indicators provide us with different clues. Accordingly, the MACD indicator points to the continuation of positive momentum, while the red bars on the Awesome Oscillator (AO) suggest the possibility of a correction.

While the V2 version is launched on six chains, the short-term movements of the UNI price remain uncertain. It is possible to say that the future course will now depend on Bitcoin’s price movements. Before continuing its rise, UNI’s price is likely to find support at the 61.8% or 50% Fibonacci retracement level. If the daily candlestick closes below the support level at $7,041, the bullish outlook may become invalid. Before continuing its ascent towards $7,972, UNI’s price could find support at $6,466 and $6,753 levels.

 Türkçe
 Español


