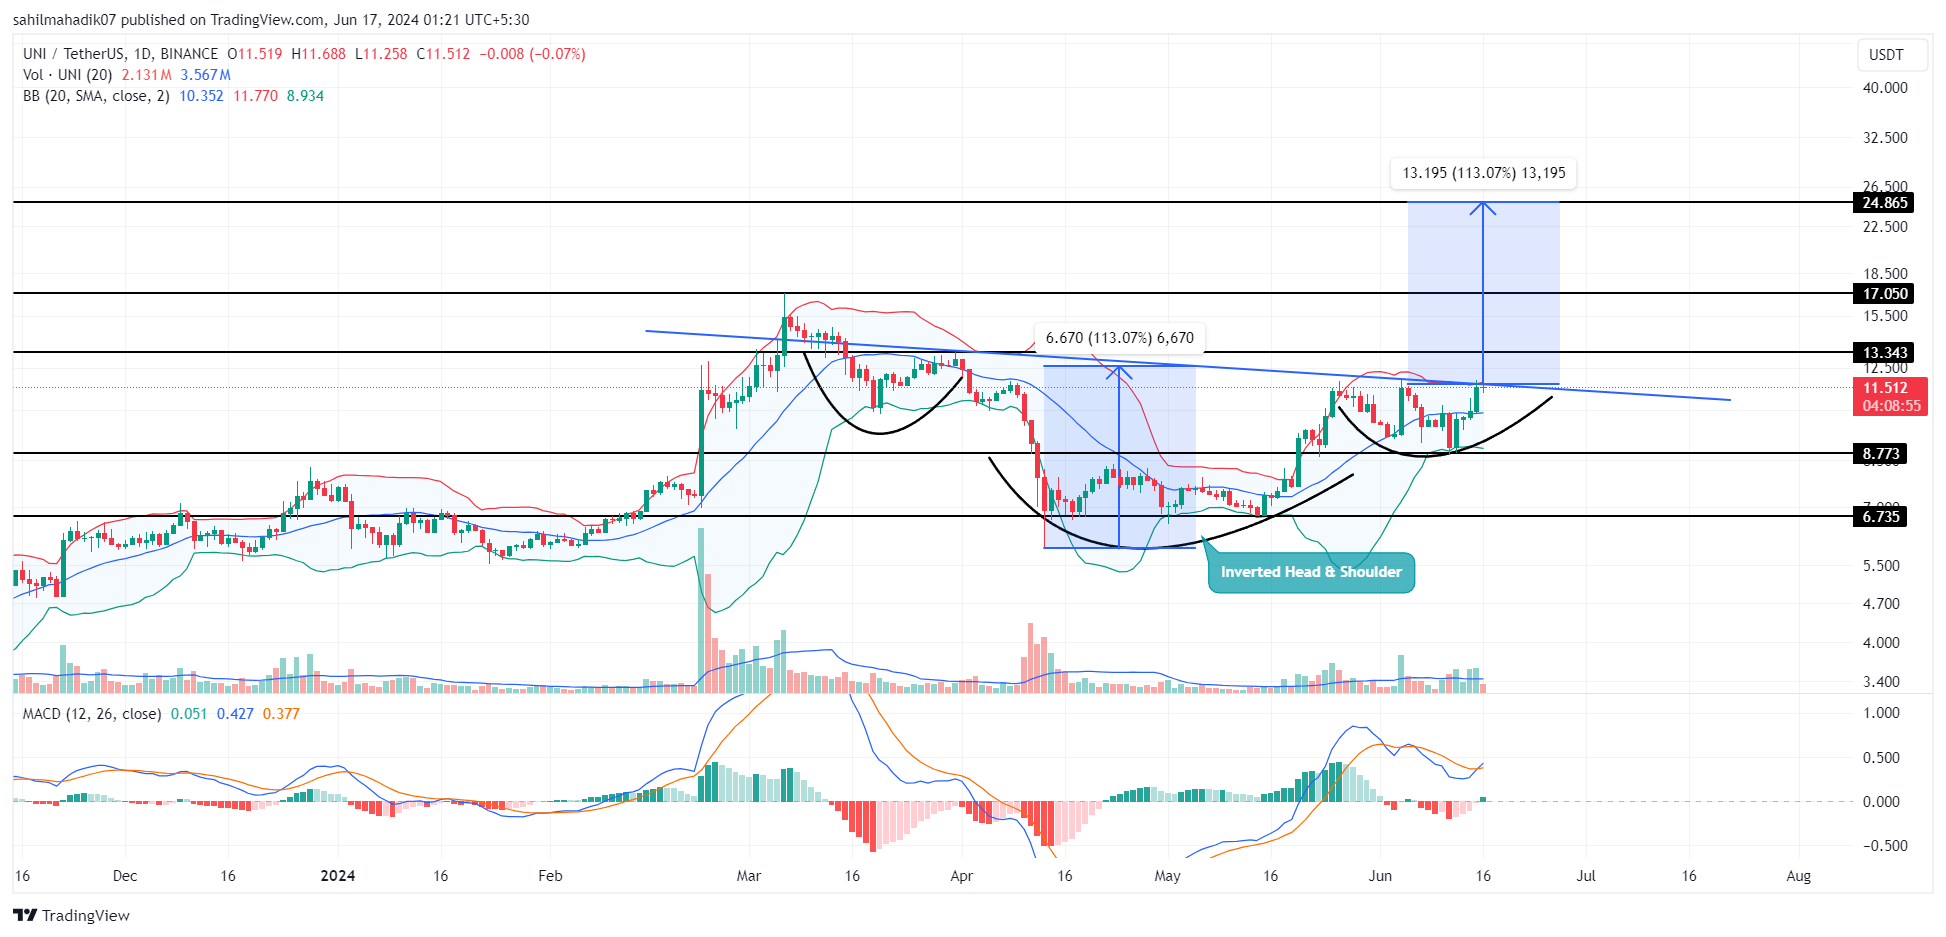
The cryptocurrency market faced significant supply pressure in the second week of June, leading to corrections in major cryptocurrencies like Bitcoin (BTC) and Ethereum (ETH). Despite this fluctuation, Uniswap (UNI) demonstrated resilience by recording a 14.5% price increase, reaching $11.5. This rise in UNI’s value contrasted with the overall market performance, highlighting the altcoin’s strength and investor confidence.
Uniswap’s Performance and Market Trend
Uniswap’s recovery began after it dropped to $6.73 on May 15. Since then, UNI has shown a strong upward trend, gaining 77% in three weeks and peaking at $11.96. However, recent market trends have slowed this upward momentum, leading to a consolidation phase.
Despite Bitcoin’s price stabilizing around $65,000 and Ethereum rising to $3,500, UNI pulled back to $8.7 before recovering, indicating strong accumulation during market downturns.
Notable Increase in Uniswap’s Open Interest: The ZKsync Factor
Currently, investor interest in Uniswap and UNI has significantly increased, with open interest rising from $89.21 million on June 12 to $146.5 million. This 64.25% increase indicates heightened market activity and expectations for future price movements. Such an increase in open interest typically suggests that investors are positioning themselves for potential gains, reflecting growing optimism about UNI’s future performance.

Another significant development strengthening Uniswap’s outlook is the integration of ZKsync into its platform. This integration allows users to swap tokens and provide liquidity on ZKsync directly through Uniswap, benefiting from lower gas fees and faster transaction times. This update is expected to increase natural demand for UNI by enhancing the platform’s efficiency and user experience.
Technical analysis of UNI’s daily chart reveals the formation of an inverse head and shoulders pattern, a bullish indicator. Typically seen at market bottoms, this pattern indicates a shift in investor sentiment towards buying. UNI is currently trading at $11.5, signaling a potential breakout from the pattern’s neckline. A successful breakout could push UNI past the $17.5 resistance level, targeting $24.86.
Bollinger Bands indicator highlights current market uncertainty, indicating the need for a decisive breakout to confirm a sustainable uptrend. Meanwhile, the Moving Average Convergence Divergence (MACD) indicator shows a bullish trend above the midline, suggesting that buyers currently hold control. This technical setup supports the view that UNI could continue its upward trajectory if market conditions remain favorable.

 Türkçe
 Español


