The United States stock markets continue to rise, powered by strong economic growth and the anticipation that inflation may slow down on an annual basis. The S&P 500 Index (SPX) climbed by 1.06% last week, moving towards the psychologically significant level of 5,000. Data from the FedWatch Tool indicates that the Federal Reserve is likely to keep interest rates steady at its meeting on January 31, but may start cutting rates from the March meeting. An expansionary monetary policy is usually seen as a positive sign for riskier assets.
S&P 500 Technical Analysis
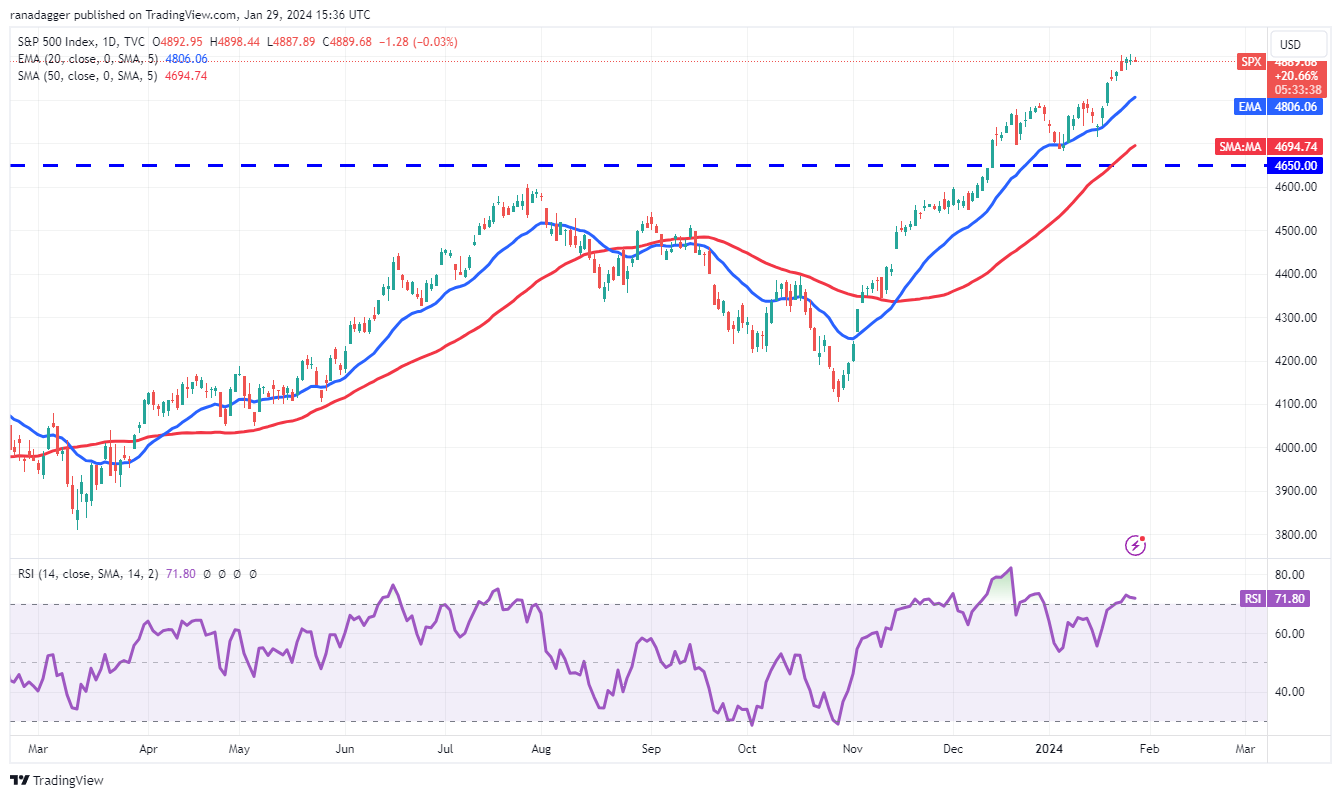
The S&P 500 Index continued its upward trajectory last week, indicating strong demand from the bulls at higher levels. The index is facing some resistance at 4,900, but the fact that bulls have not yielded ground to bears is a positive sign. This suggests that buyers are expecting the uptrend to continue.
If buyers push the price above 4,907, the index could reach the 5,000 level, where bears might mount a strong defense. On the downside, the critical support to watch is the 20-day exponential moving average at 4,806. Breaking below this support could lead to a deeper correction towards the 50-day simple moving average at 4,694.

DXY Technical Analysis
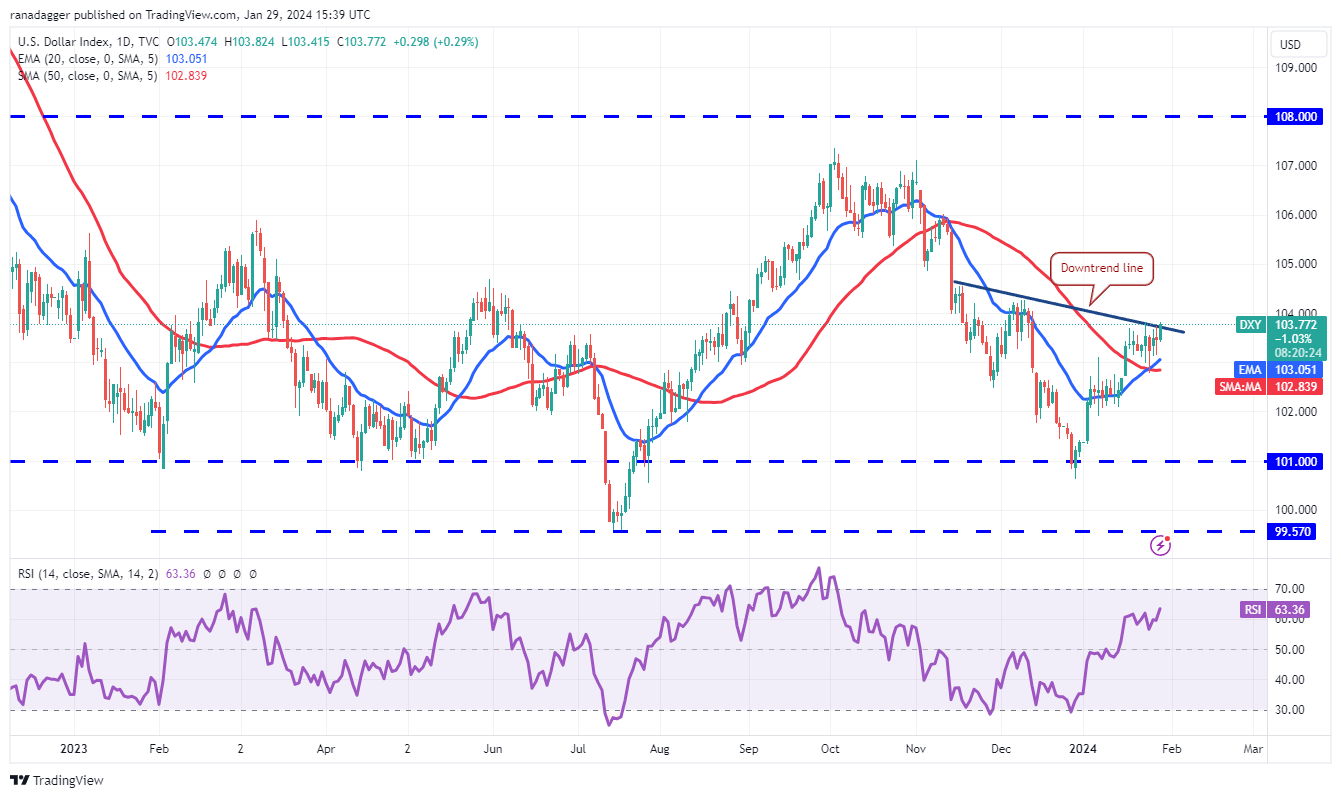
The US Dollar Index (DXY) is encountering resistance at the downtrend line despite a recent recovery, but bulls have managed to keep the price above the moving averages, which is a positive indicator. The rising 20-day EMA at 103 and the Relative Strength Index (RSI) in the positive zone suggest that the path of least resistance is upwards.
If buyers can push and sustain the price above the downtrend line, the index could rise to 104.50 and then to 106. Conversely, if the price turns down from the overall resistance and falls below the moving averages, it would indicate that bears are fiercely defending the downtrend line, potentially leading the index to retreat to 102.

Bitcoin Technical Analysis
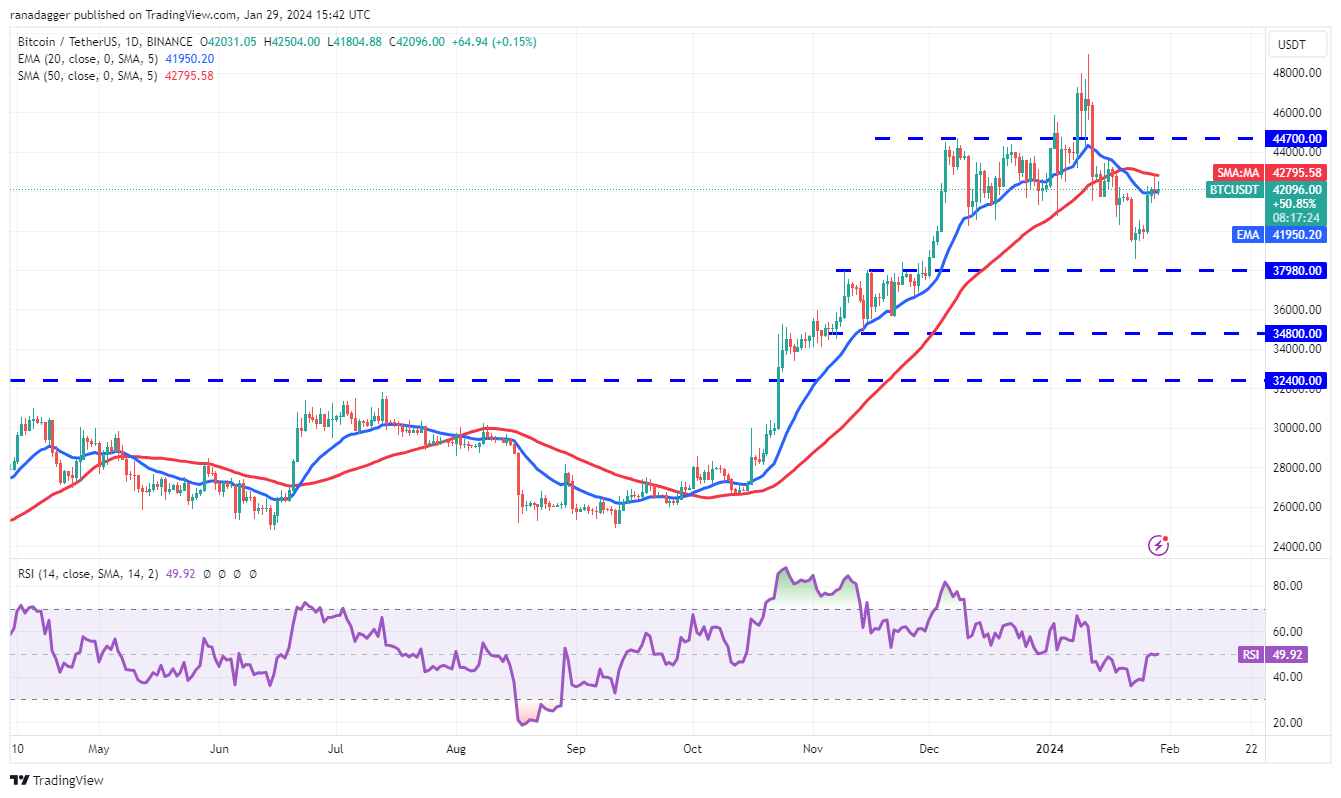
Buyers attempted to push Bitcoin above the 50-day SMA level of $42,795 on January 28 and 29, but bears held their ground. The flat moving averages and RSI near the midpoint do not give a clear advantage to either bulls or bears. If bulls can drive the price above the 50-day SMA, the BTC/USDT pair could reach the $44,700 level, which is likely to attract strong selling by bears. A reversal from the $44,700 level and a drop below the moving averages could indicate that the range-bound movement may continue for several more days.
On the other hand, if the price falls below the 20-day EMA level of $41,950 and stays below it, the pair could gradually descend to the $40,000 level and then to $37,980. The next trend movement could begin following either the buyers pushing the price above $44,700 or bears pulling the pair below $37,980.


