
The cryptocurrency market has seen significant activity in the last 24 hours, with short-term price increases observed for XRP, Ethereum (ETH)  $3,139, and Solana
  $143 (SOL). XRP surged by 3.25%, challenging the $2.50 threshold, while Ethereum rose by 4.60% to reach $2,100. Solana demonstrated a robust increase of 9.09%, climbing to $145. However, their performance over the past 30 days indicates that they remain under pressure in the medium term.
What Is the Target Price for XRP? Chart Analysis and Commentary
XRP’s short-term chart shows positive signals. The 4-hour chart indicates that the 50-period moving average is trending upwards, suggesting that the price may maintain its upward momentum. Nevertheless, the daily chart reveals that the price is still below the 200-day moving average, indicating a continued long-term bearish outlook. For XRP to enter a bullish trend, it must break through the critical resistance level of $2.50 to $2.55 with high trading volume.
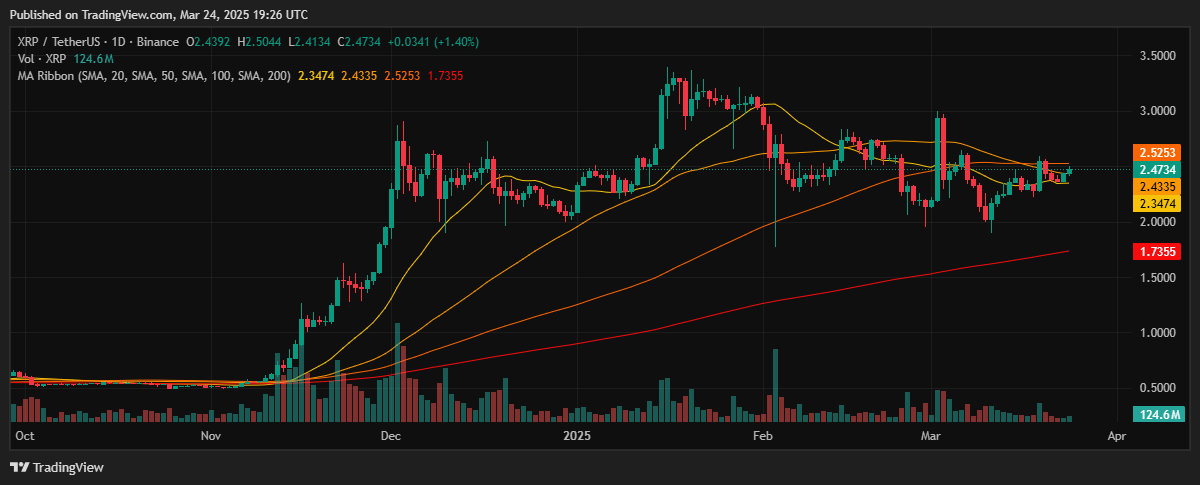
The nearest support zone is around $2.40 to $2.45. If XRP coin cannot hold this level, it may decline to $2.30. The market anticipates that for a continued rise in the short term, XRP needs to break above the resistance zone.
Ethereum Price Chart Analysis: The Critical $2,100 Threshold
Ethereum shows a strong recovery in the short term. The Relative Strength Index (RSI) is at mid-levels, indicating that the price has not yet determined a clear direction. Currently, ETH price is approaching the critical resistance level between $2,100 and $2,130. If this area is breached with substantial volume, the price could rise to between $2,200 and $2,400.
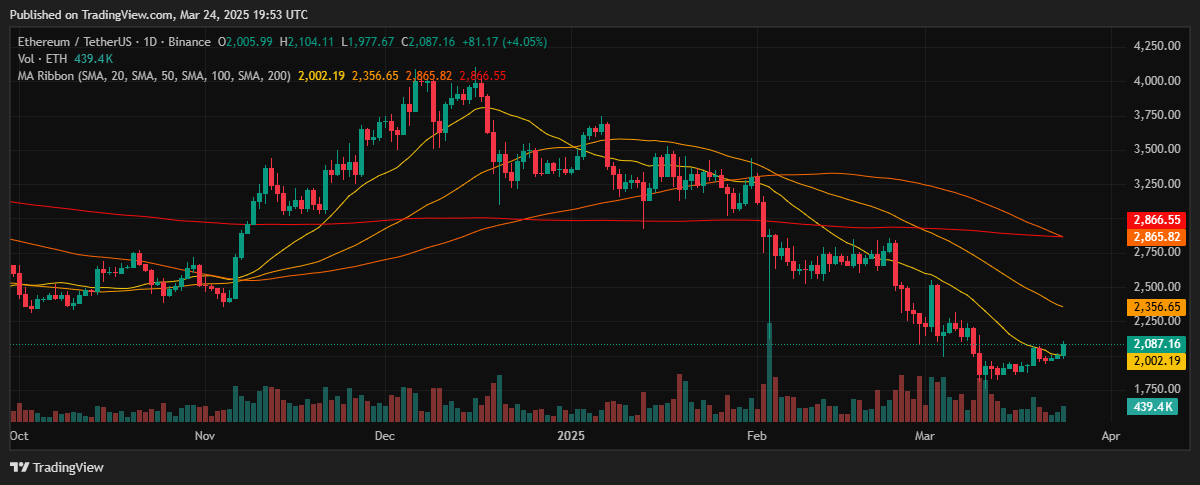
The critical support level for ETH coin is identified at $2,050 to $2,070. If this support fails, the price may retreat to the $1,900 to $1,950 range. The market is closely monitoring developments that will determine Ethereum’s direction.

What Is the Short-Term Target Price for Solana? Price Commentary and Analysis
Solana, which increased by 9.09% in the last 24 hours, shows positive signs in the short term. The 4-hour chart reveals that the 50-period moving average has turned upward, supporting the rise. The most significant resistance level is the $145 to $150 area. If this level is surpassed with high trading volume, SOL could rise to the $155 to $160 range.
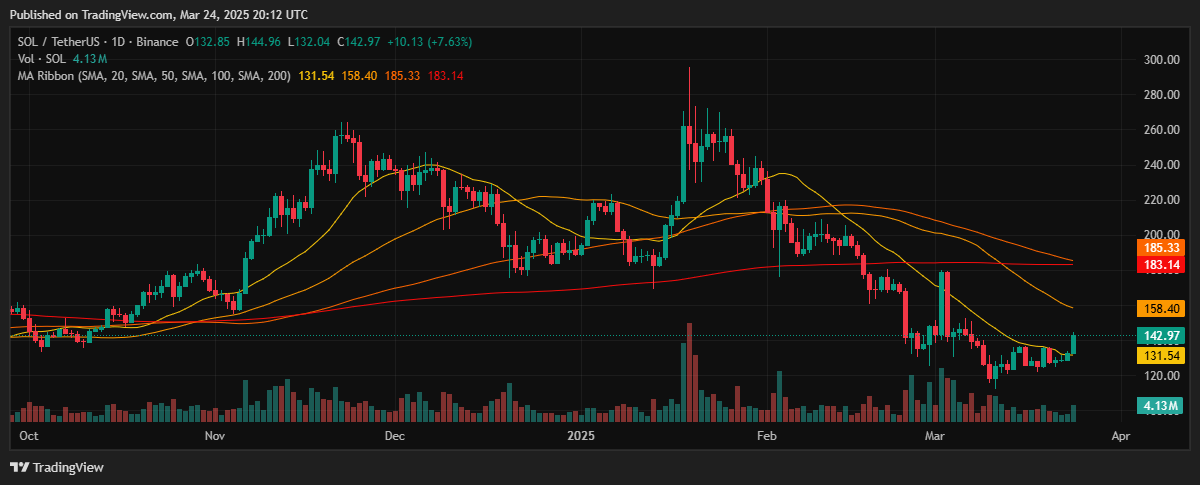
The closest support level for SOL coin is between $138 and $140. If this support is not maintained, the price may decline to the $130 to $135 range. Market participants are closely watching whether Solana can break through its current resistance zone.