It has been announced that Cosmos (ATOM) will now be available on Binance chain through IBC. This development is believed to potentially create more opportunities for stake operations in smart contracts. However, the 8% increase that followed the announcement was not sustainable, as the gains were replaced by negative movement.
Previous chart analysis has highlighted the significance of the $7 level as a major support level for ATOM. Despite experiencing over 10% growth last week, bears put an end to the upward movement. So, what can investors expect from ATOM in this price action environment?
The Downtrend and Price Movements of ATOM
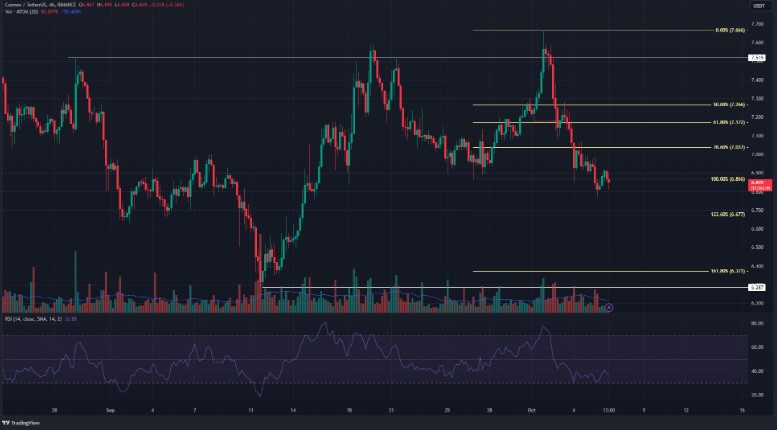
After the increase it experienced last week, ATOM has lost all its gains and is now in a negative position. Looking at the Fibonacci levels (light yellow), it can be seen that there was a price close below $6.866, which was the lowest level of September, according to the four-hour price chart. Falling below the 78.6% retracement level may indicate that ATOM’s price is possibly heading downwards.

The levels of $6.67 and $6.37 are notable points where bulls continue to fight to prevent losses. Looking at the Relative Strength Index (RSI), the value is at 36. The direction of RSI at 36 may only signify a decline for investors. The market structure also confirms this situation.
The price level of $6.28 is nothing more than the lowest price level seen in September. Therefore, if the price falls below $6.67, it may potentially drop to the region between $6.28 and $6.37 before giving bulls a chance.
Current Market Situation
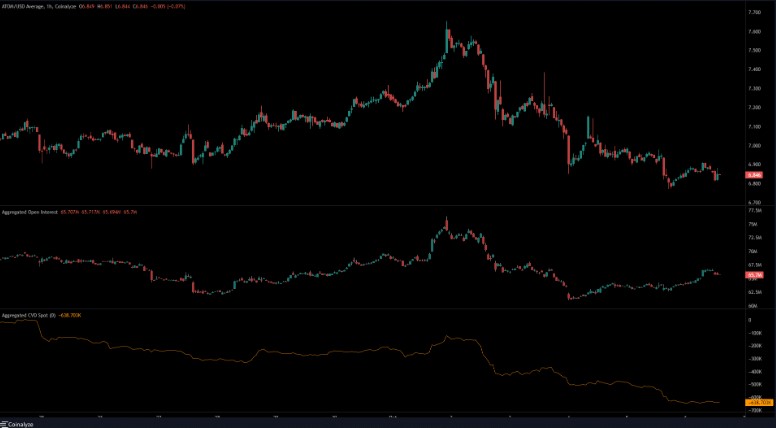
After the rise, on October 4th, while the ATOM price dropped from $7 to $6.93, Open Interest (OI) slightly increased. This indicates that there are a considerable number of short sellers aiming to reduce their losses.
The sensitivity sentiment in ATOM still does not appear to be turning bullish. Additionally, the appearance of the spot Cumulative Volume Delta (CVD) is also a concern for bulls.


