The weekend has arrived, and usually these periods are times of significant drops. So what will happen this time? The price of Bitcoin couldn’t close above the $30,400 region, so the outlook is negative. However, investors need to be prepared for levels to visit when volatility increases.
Bitcoin (BTC) Chart Analysis
Bitcoin continues to test investors’ patience by remaining stuck in a narrow range. After boring periods like this, we are used to seeing significant movements, so there is no need to be discouraged. Glassnode’s latest weekly bulletin highlighted that Bitcoin’s consolidation has narrowed the Bollinger Bands, which have only a 4.2% difference. Referring to various on-chain indicators, the authors concluded that investors are reluctant to sell, and the situation is similar to periods characterized by “volatile market conditions like 2016 and 2019-20.”
Although the short-term outlook for Bitcoin is uncertain, the long-term trend is still upward. Charles Edwards, the founder of Capriole Investments, said that allowing BlackRock’s exchange-traded fund application could “facilitate institutions putting Bitcoin on their balance sheets.”
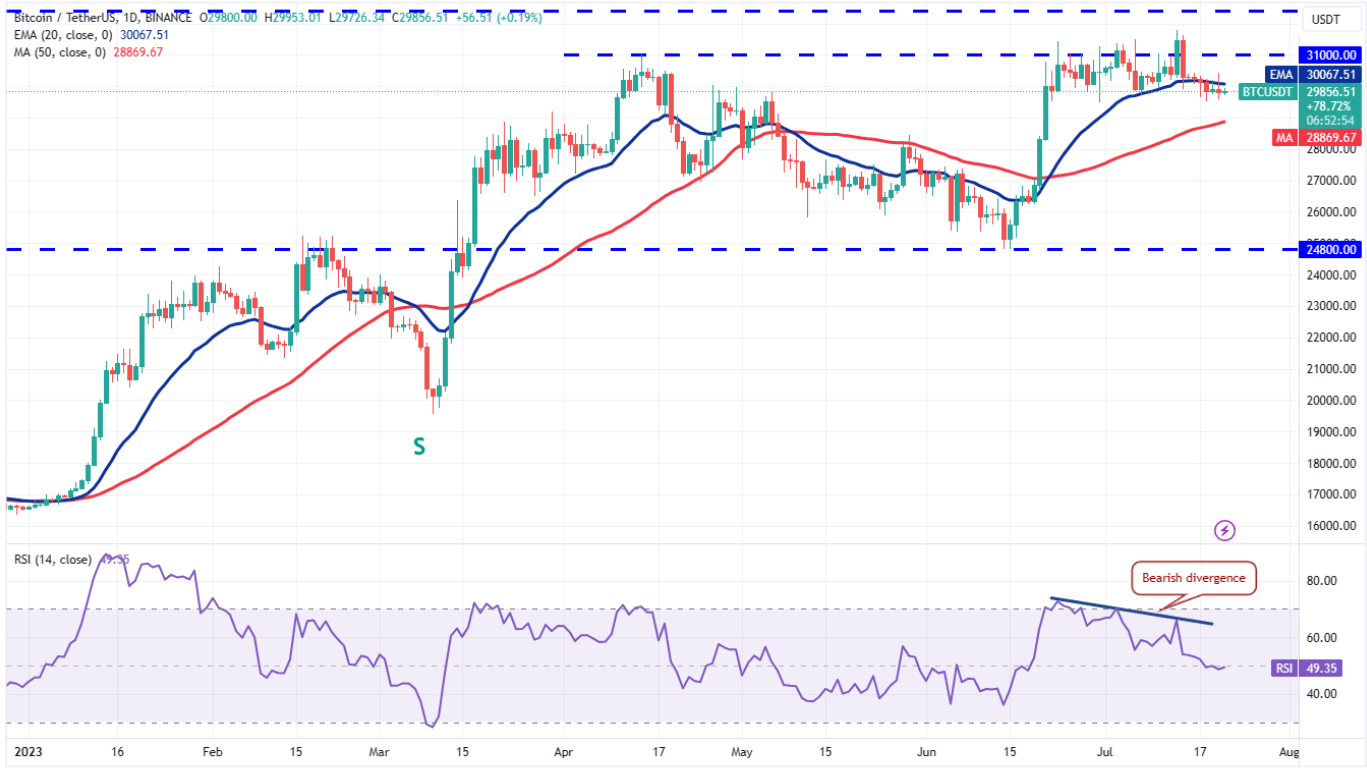
Bitcoin has been trading below the 20-day exponential moving average (around $30,400) since July 17, which is a negative sign. It indicates that there is no aggressive buying at current levels. Bulls pushed the price above the 20-day EMA on July 20, but the long wick on the candlestick shows selling pressure at higher levels. Bears will struggle to bring the price below $29,500 in the next few hours.

In a bearish scenario, the price could decline to $28,869 (50-day simple moving average) and even $27,500. Conversely, if the price sharply rises and crosses above the 20-day EMA, we will see the pair climb to $31,000 and $32,400.
The upcoming Fed meeting next week and other negative factors indicate that the bearish scenario is currently more likely.
Ethereum (ETH) Chart Analysis
Just when the price surpassed $2,000, Bitcoin pulled down Ethereum (ETH) again. While many altcoins have recovered over 200% from the bottom, it is truly frustrating to see ETH’s price suffer despite the increasing stake rate and decreasing supply on exchanges due to negative inflation. However, what matters for long-term investors is what the price will be tomorrow.
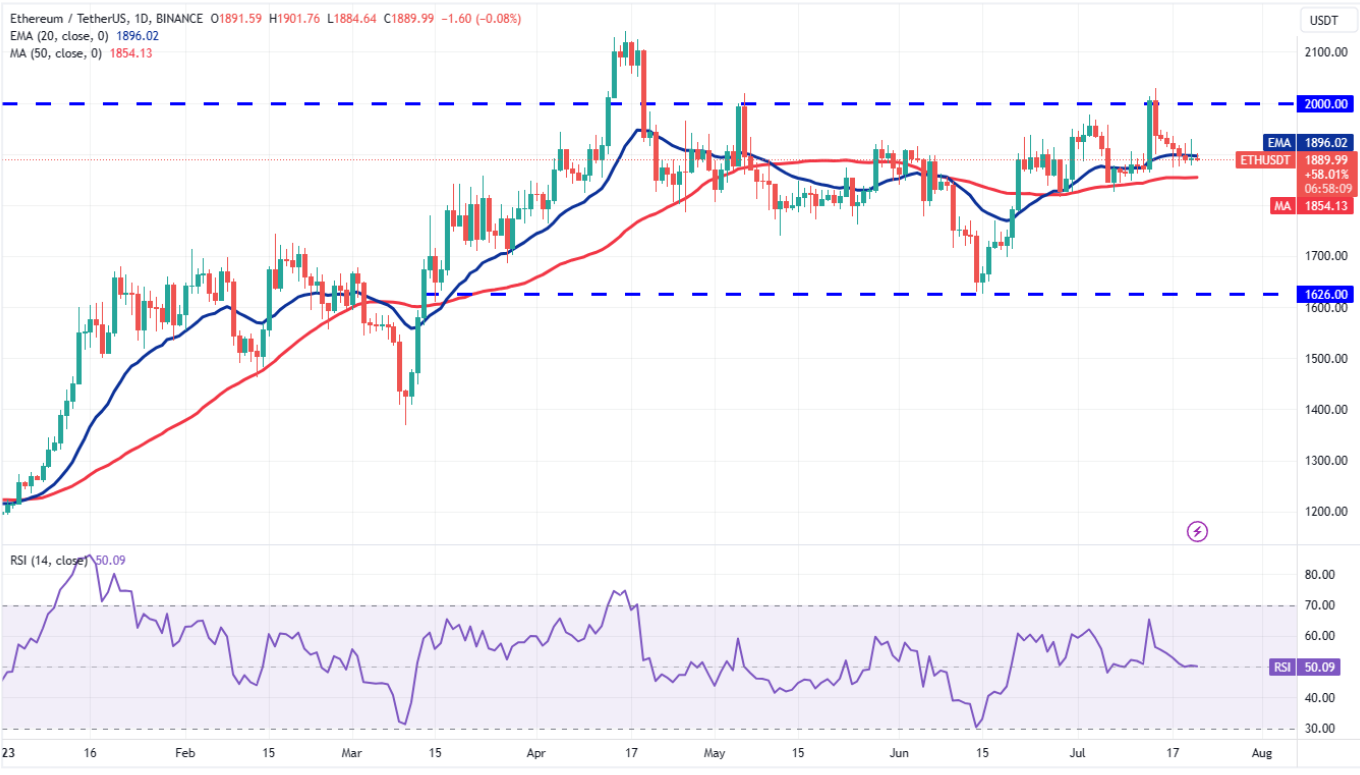
ETH is trading near the 20-day EMA ($1,896). This indicates a balance between bulls and bears. The significant support to watch on the downside is the 50-day SMA ($1,854) region. If this level is broken, we could see a visit to $1,800 and $1,700. The ultimate bottom in the short term would be around $1,626.

On the contrary, if the price rises from the current level or the 50-day SMA and crosses above $2,000, it could climb to $2,141 and $2,200.
Possible negative events this weekend could result in a visit to the initial supports for BTC and ETH. Larger sell-offs could lead to testing lower supports. Especially for altcoin investors, it seems beneficial to be prepared for possible breakouts mentioned above for BTC and ETH in the next 48 hours.


