Polygon (MATIC) price seems to have broken out of a short-term descending triangle formation and is attempting to surpass a long-term descending resistance line. This could trigger a significant price increase. However, if the mentioned point is rejected, it could lead to a drop towards the nearest horizontal support area.
MATIC Coin Analysis
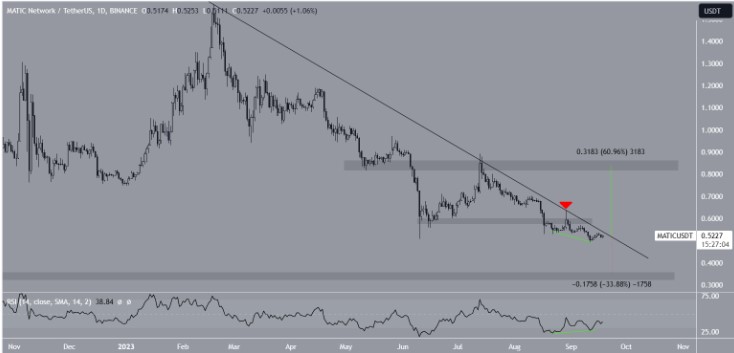
Looking at the daily timeframe technical analysis of MATIC, it can be seen that the price has fallen below a descending resistance line since reaching its highest level of $1.57 on February 28. While following the line, the price also experienced a drop from the $0.60 horizontal support area.
Then, on August 29, it was assumed that the area was confirmed as resistance (red symbol). Based on the confirmation, it was decided that this was another sign of a downward trend after the last touch on the decreasing resistance line. The price has not reached the same line since then.
If the MATIC price manages to rise from the line, it could increase by 60% and visit the $0.85 horizontal resistance area. However, if it is rejected again, a 35% drop to the nearest support at $0.35 could be a possible future move. Although the price movement appears to be bearish, the daily Relative Strength Index (RSI) may indicate a potential reversal in the upward trend.

Investors use RSI to determine whether the buying and selling are overdone. This helps in identifying asset accumulation or sales. RSI above 50 during an uptrend favors the bulls. An RSI value below 50 may indicate the opposite price movement.
Although the indicator is still below 50, it is continuing to rise. More importantly, it has formed a bullish divergence (green line). This can occur when a momentum increase accompanies a price decrease. It can also lead to a reversal of the upward trend. In the case of MATIC, a breakout from the long-term descending resistance line can be expected.
MATIC Coin Future
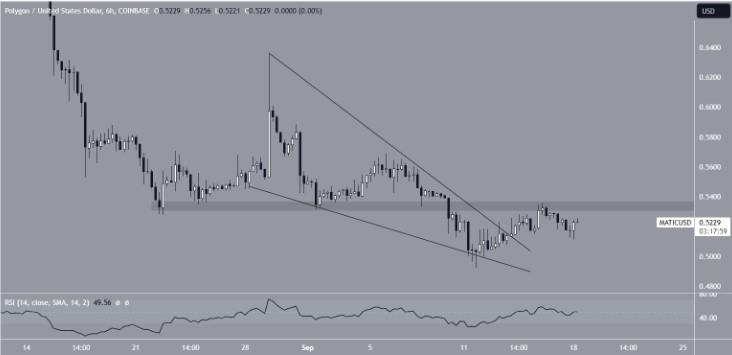
When examining the shorter-term six-hour timeframe, it can be predicted that the price can successfully break out of the long-term resistance line. The main reason for this is that the price has already broken out of a short-term descending wedge. This wedge formation is considered a bullish formation and can trigger an upward movement from the long-term resistance line.
The six-hour RSI can also positively influence the ongoing price increase and movement above the long-term resistance line. The indicators are currently performing an upward movement and have crossed above 50. The remaining main obstacle can be considered as a small resistance at $0.53. When MATIC surpasses this, it can potentially move towards the resistance above $0.85.
Therefore, the most likely MATIC price prediction indicates a breakout from the resistance line and a potential increase towards $0.85. However, if the price reverses from the resistance line, a 35% drop to the $0.35 horizontal support area could be a possible future price movement.


 Türkçe
 Español


