Türkçe
 Español


Shiba Inu (SHIB), the second largest meme coin by market value, continues to experience a decline, just like other altcoins. The losses of altcoins increased as Bitcoin bulls failed to regain the $28,300 resistance and lost the $27,200 support. The last straw that broke the camel’s back for BTC was the attempted recovery of the $26,800 support.
Shiba Coin (SHIB)
Shibarium caused great excitement but failed to trigger the expected price increase. Although the network errors during the launch period have been resolved, interest in the L2 solution is decreasing. We have been emphasizing for weeks that the price of SHIB may decline due to the unsuccessful L2. The current price is $0.00000685.
On the technical side, the downtrend continues as the long-term descending trend line was lost in August. This area functions as resistance on the weekly chart, and this trend line has been intact for 427 days without being broken.
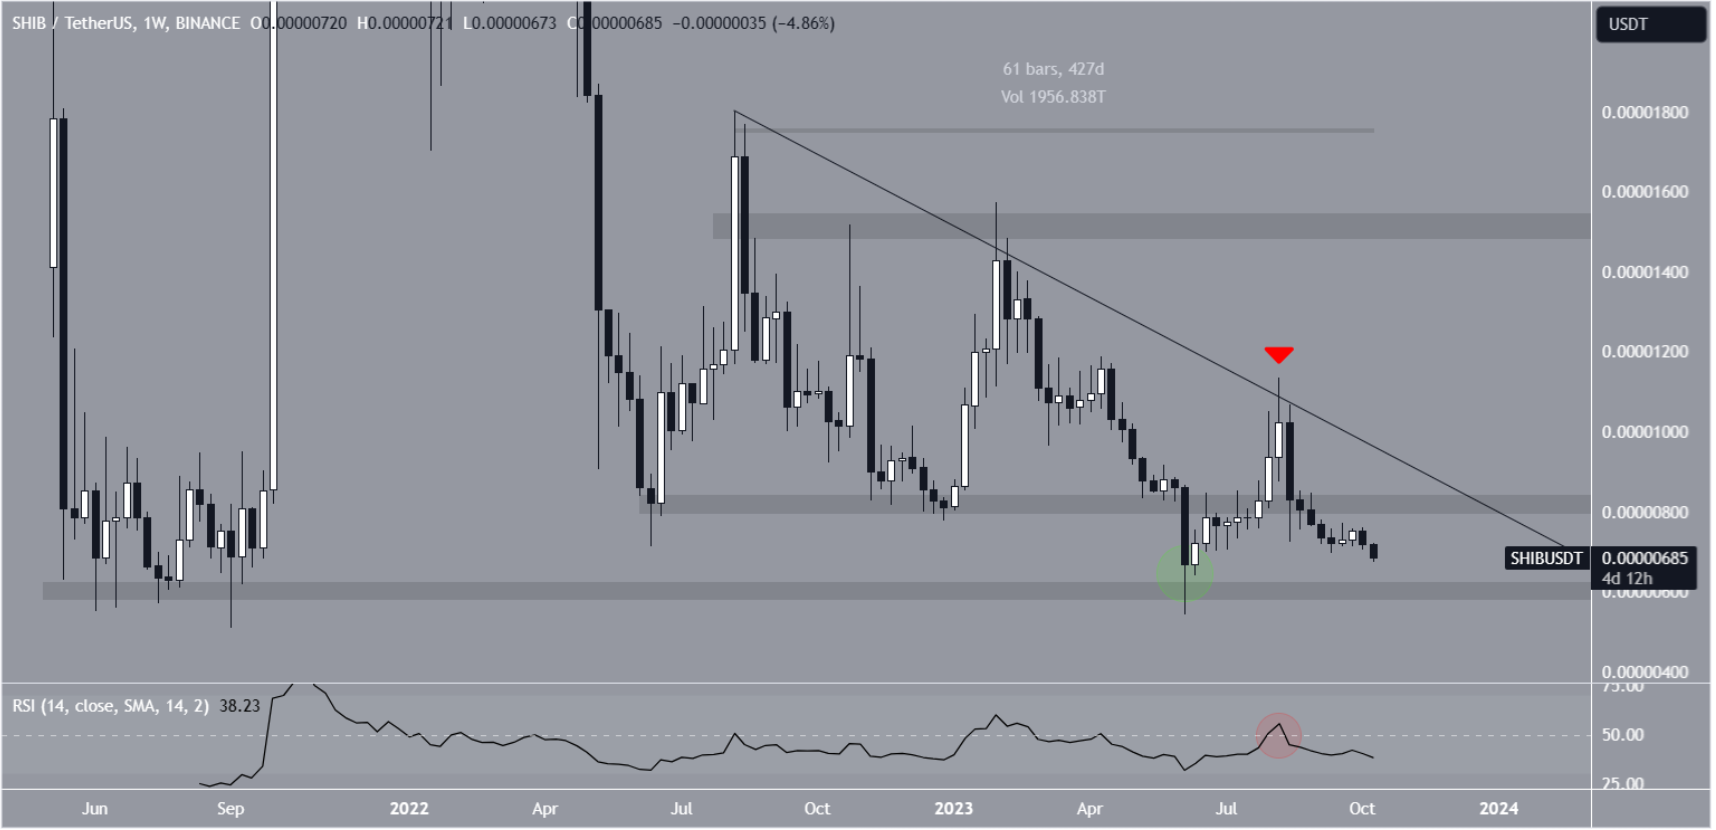
The important support level was $0.000008, and Shiba Coin spent a lot of time below this horizontal support area. Apart from a minor deviation in July, we had seen that this area has provided support for over a year.
Investors expected the above-mentioned support area to be tested as resistance, but that didn’t happen either. This situation disappointed waiting investors to minimize their losses. The steady decline in the price of Shiba Coin hindered the possibility of a temporary rise. It would be a lie if we say that Shibarium has no contribution here.
Will the Price of Shiba Coin Increase?
If we turn to the daily chart, it is difficult to determine a definite direction. The price has been moving downwards within a decreasing parallel channel for almost two months. Although we saw a bounce from the support line of the channel in mid-September, it did not last long. The price, which was rejected from the resistance level of the channel on October 2, has been falling for 11 days.
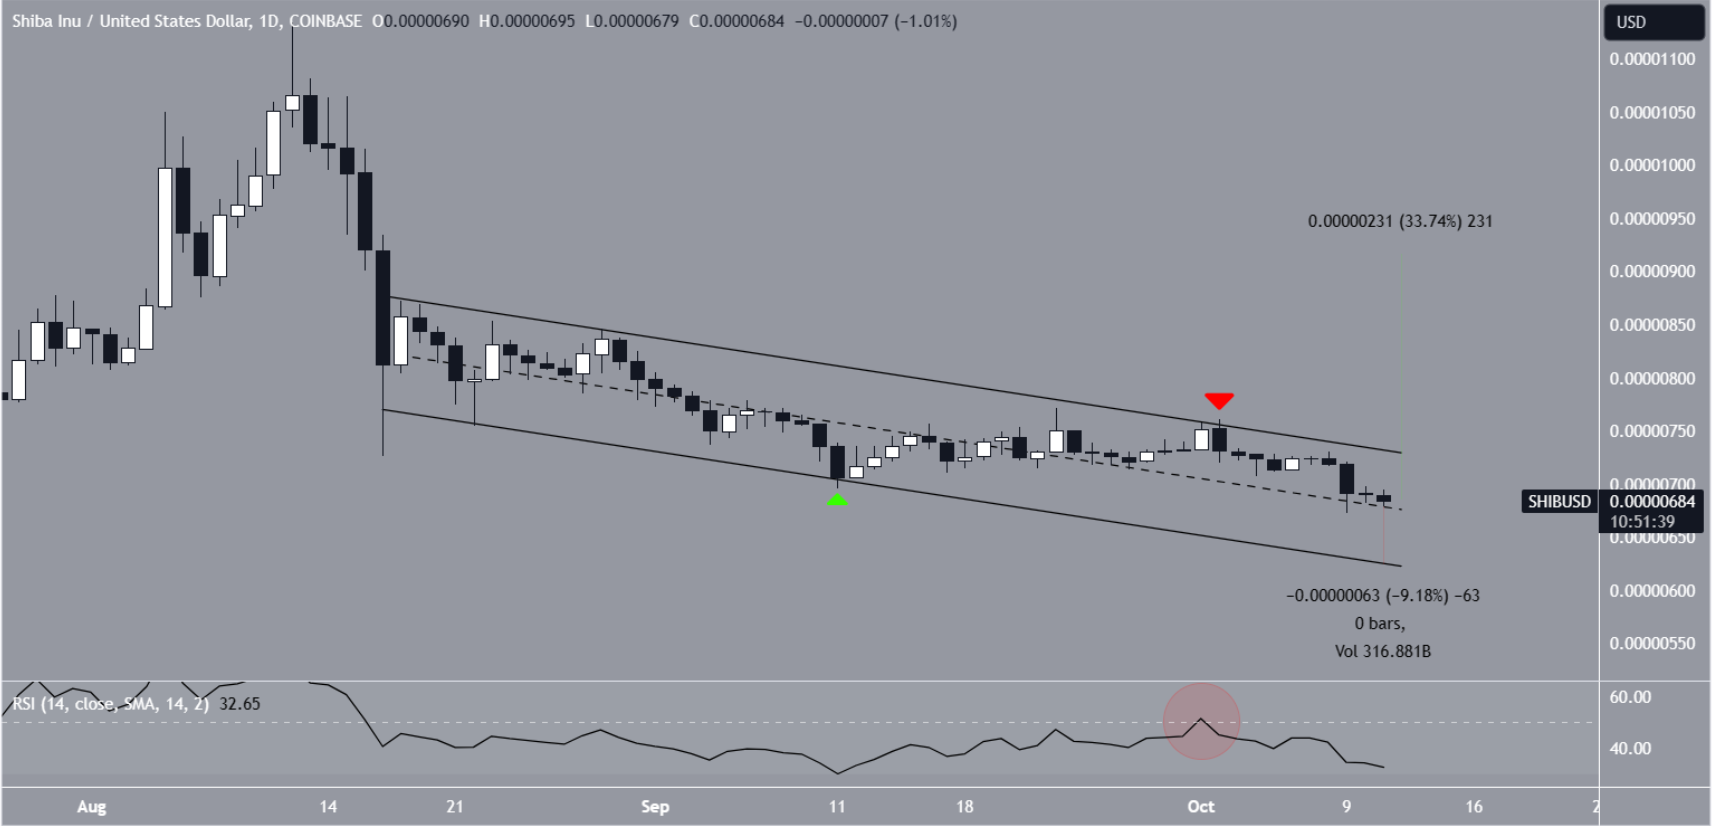
RSI cannot surpass the neutral zone, confirming the downtrend. Taking a deep breath and digesting all these details, the most likely scenario seems to be a pullback towards the support line at $0.0000065.
But what if the resistance level of the daily chart’s channel is surpassed? That’s when the expectation of a decline reverses. With a breakout from the channel, we can see that the price aims to increase by 33% and reach $0.0000095.