Solana, considered one of the important pillars of the cryptocurrency world, experienced a 4.5% increase in price on Monday with the rise of Bitcoin and continues to trade at $24. This price movement was triggered by the approval of Ethereum futures ETFs by the U.S. Securities and Exchange Commission (SEC).
While this development created a positive atmosphere in the entire cryptocurrency market, Bitcoin (BTC) price exceeded $28,000. Ethereum price moved above $1,700, and Solana experienced a price movement just above $24.
Solana Price Forecast
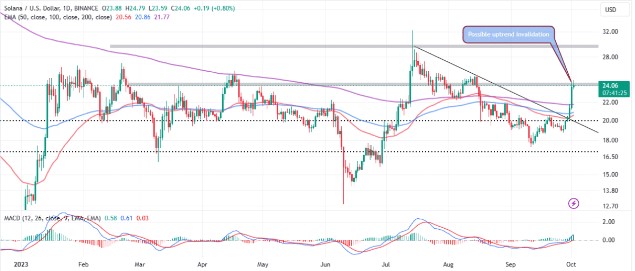
The price target for Solana is seen as $30, but there is a significant obstacle at $25. This resistance level can invalidate all upward movements. According to the analyzed daily price chart, there is a potential for an upward movement. The buy signal in the MACD indicator also seems to support the bullish outlook.
In addition, investors who maintain long positions in Solana can choose the momentum indicator above the average line (0.00) as the area to watch. An upward movement in the positive zone in the MACD can help investors remain enthusiastic about Solana’s movement towards the price target of $30.

When the charts of Solana are examined, it shows that bulls have an advantage over bears in terms of the positions of the 50, 100, and 200-day Exponential Moving Averages (EMA) indicated in red. When these indicators are examined, a price movement that can occur above $25 and subsequently reach $30 may be more likely than a price below $20.
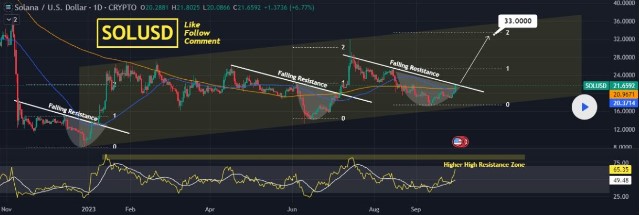
TradingBrokersView, which attracts attention with its analysis on Tradingview, emphasized a structure where Solana’s price broke several descending trendline resistances, then rallied and had a potential rise/fall graph before a potential correction.
The analyst’s explanation on the subject was as follows:
The previous two breakouts on these types of resistances that occurred in the last 12 months ended with a new high peak in our main upward channel formation. Therefore, there is a possibility for the ongoing breakout to extend up to $33 without making a correction and holding on to a higher support, preferably above $25.

The Future of Solana
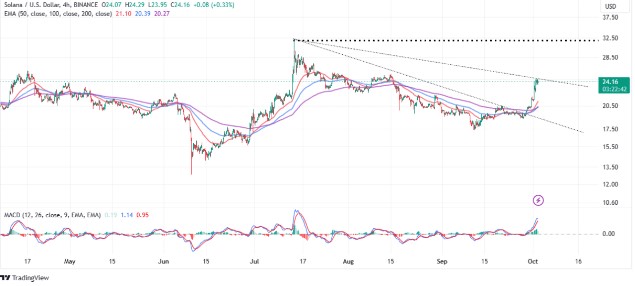
The price resistance at $25 seems to intersect with a descending trendline seen on the four-hour price chart. For the upward movement in price to continue, Solana will need to move above this intersection point. If this does not happen and a downward movement occurs, Solana may move towards $20 and need to gather more liquidity.
Another indicator that investors should pay attention to is the Moving Average Convergence Divergence (MACD). After a clear movement to the point corresponding to +1.13, which can occur above the average line (0.00), the upward trend may come to an end.

 Türkçe
 Español


