The price of popular meme token Shiba Inu (SHIB) has fallen from the horizontal support level of $0.0000080, indicating a downward trend. According to experts, weekly time frame analysis suggests a definite downward trend, while the daily time frame presents a more neutral outlook.
Will the Decline Continue in SHIB?
Analysts’ technical analysis on the weekly time frame indicates a downward direction in SHIB price. The price movement shows that the meme token has been declining since being rejected by a resistance line in August. This retreat has caused a break below the horizontal support level of $0.0000080.
According to experts, the mentioned area can now likely provide resistance. In addition to the rejection, the weekly RSI presents a bearish outlook. Investors can use RSI as a momentum indicator to determine whether a market is overbought or oversold and decide whether an asset should be accumulated or sold.
If the RSI value is above 50 and the trend is upward, bulls have the advantage, but if the reading is below 50, the opposite is true. The indicator was rejected by the 50 level and is falling. Both of these could be signs of a downward trend. If the cryptocurrency continues to decline, the next closest support area could be at $0.0000060, a decrease of 18% from the current price.
On the other hand, a sudden increase in momentum and a breakout from the descending resistance line could potentially lead to a rise to $0.0000150, an increase of 100%, according to analysts. However, this scenario does not seem very likely at the moment. Analysis on the six-hour time frame offers conflicting readings from both price movement and RSI.
Future Price Predictions for SHIB
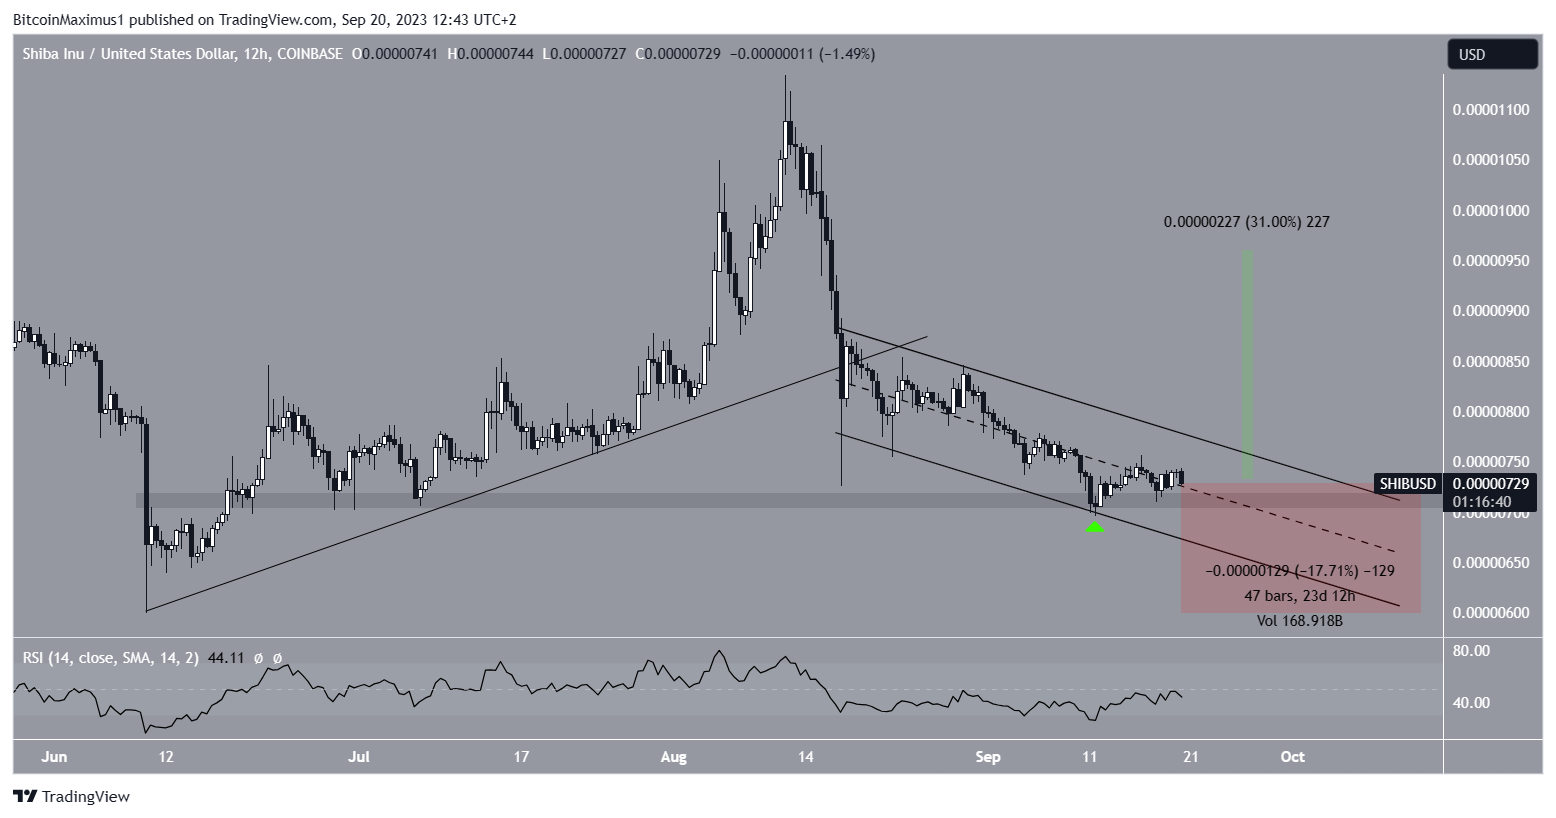
The SHIB price confirmed the end of the previous upward movement by breaking through an ascending support line on August 17. However, since then, the price movement has remained within a descending parallel channel. These channels usually involve corrective movements, which could mean an expected breakout.
Additionally, the price of the meme token bounced off the support line of the channel on September 11. This increase coincided with a small horizontal support area of $0.0000072. The six-hour RSI is also uncertain. While the indicator is rising, it still remains below 50, which can make the future trend uncertain.
In conclusion, if the price of Shiba Inu continues to decline, it could reach the $0.0000060 area on October 12, as that region could coincide with the support line of the channel. However, if a breakout occurs in the channel, the SHIB price prediction could turn bullish. In that case, a potential 30% increase towards the long-term resistance line of $0.0000095 could be possible.


