According to data obtained from 21milyon.com, Pepe (PEPE) and Floki (FLOKI) stood out as the leaders of the recent cryptocurrency market rally. Both memecoins experienced over 80% surge.
PEPE Rally Continuation?
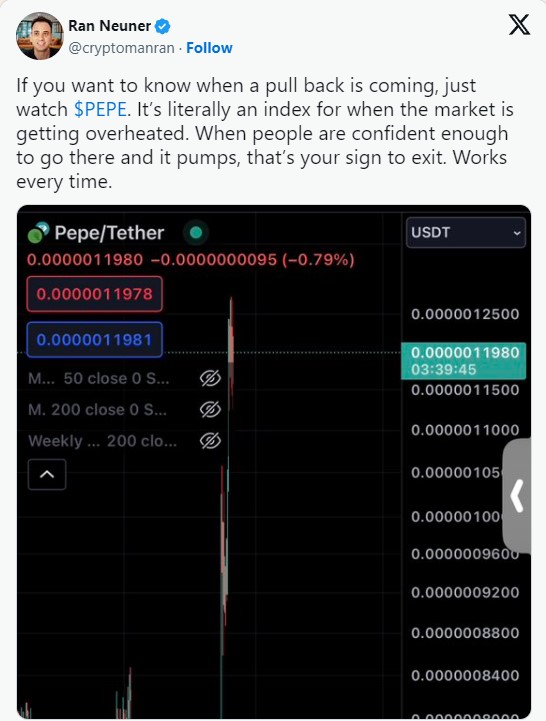
Renowned crypto analyst Ran Neuner recently made a statement on X (formerly known as Twitter). According to the analyst, this situation could be a sign of a potential market pullback.
Neuner’s warning is based on historical data. In the past, PEPE has witnessed significant surges before major market pullbacks. History provides examples of this phenomenon.
For instance, in May 2023, PEPE experienced an increase of over 1,000% between May 1st and May 5th, challenging the market. During the same period, the price of BTC dropped by almost 5%.

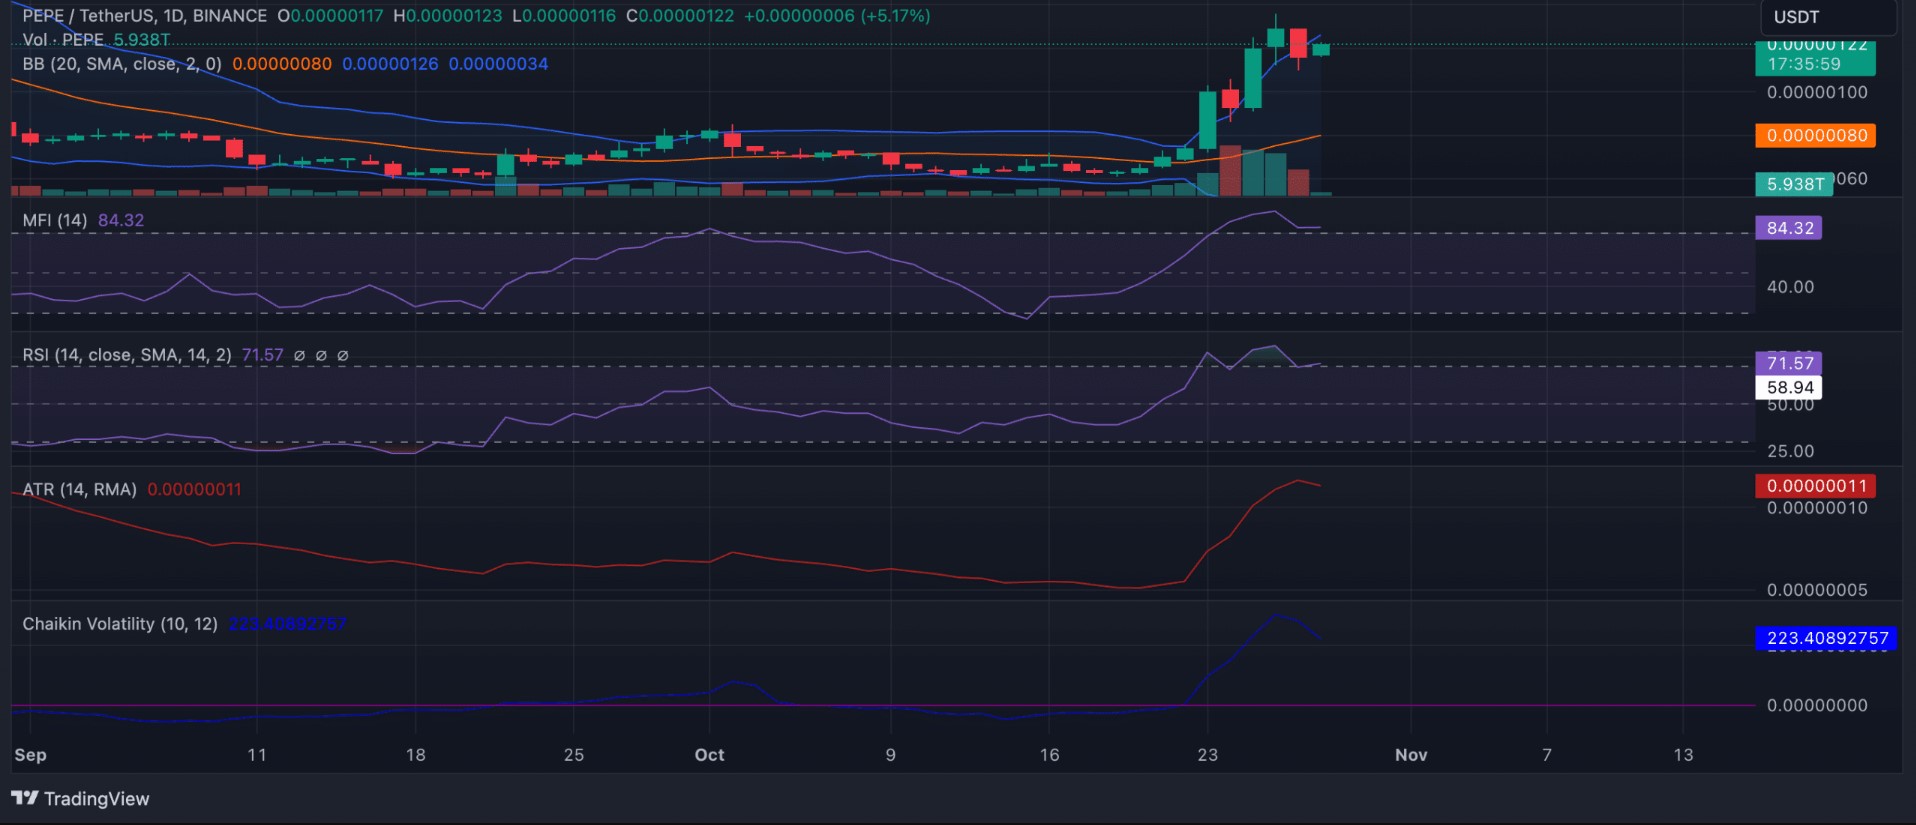
At the time of writing, the popular meme coin was trading at $0.000001215. However, the sentiment reflected in the token’s daily chart might indicate a potential reversal in the price in the coming days.
Upon analyzing the chart, PEPE’s price was found to be above the upper band of the Bollinger Bands indicator. This indicator aims to examine overbought and oversold conditions of an asset in a market, as well as identify potential trend reversals.
Generally, when the price of an investment asset surpasses the upper band of this metric, it indicates overbought conditions specific to the asset. It also suggests that the asset has significantly exceeded the average price, which is interpreted by traders as a potential reversal in price movement.
PEPE’s Indicators and Future
Indicators indicating momentum were also at overbought levels at the time of writing. PEPE’s Relative Strength Index (RS) and Money Flow Index (MFI) were at 71.57 and 84.32 levels, respectively.
Furthermore, meme coins are known for experiencing significant price movements within short periods of time. PEPE coin is no exception, and the volatility observed in its daily price movement is an indicator of this. For example, the Chaikin Volatility indicator for the token has been rising since the start of the rally on October 22nd. During this period, the indicator has shown an increase of over 1000% and was at 223.40 at the time of writing.


 Türkçe
 Español


