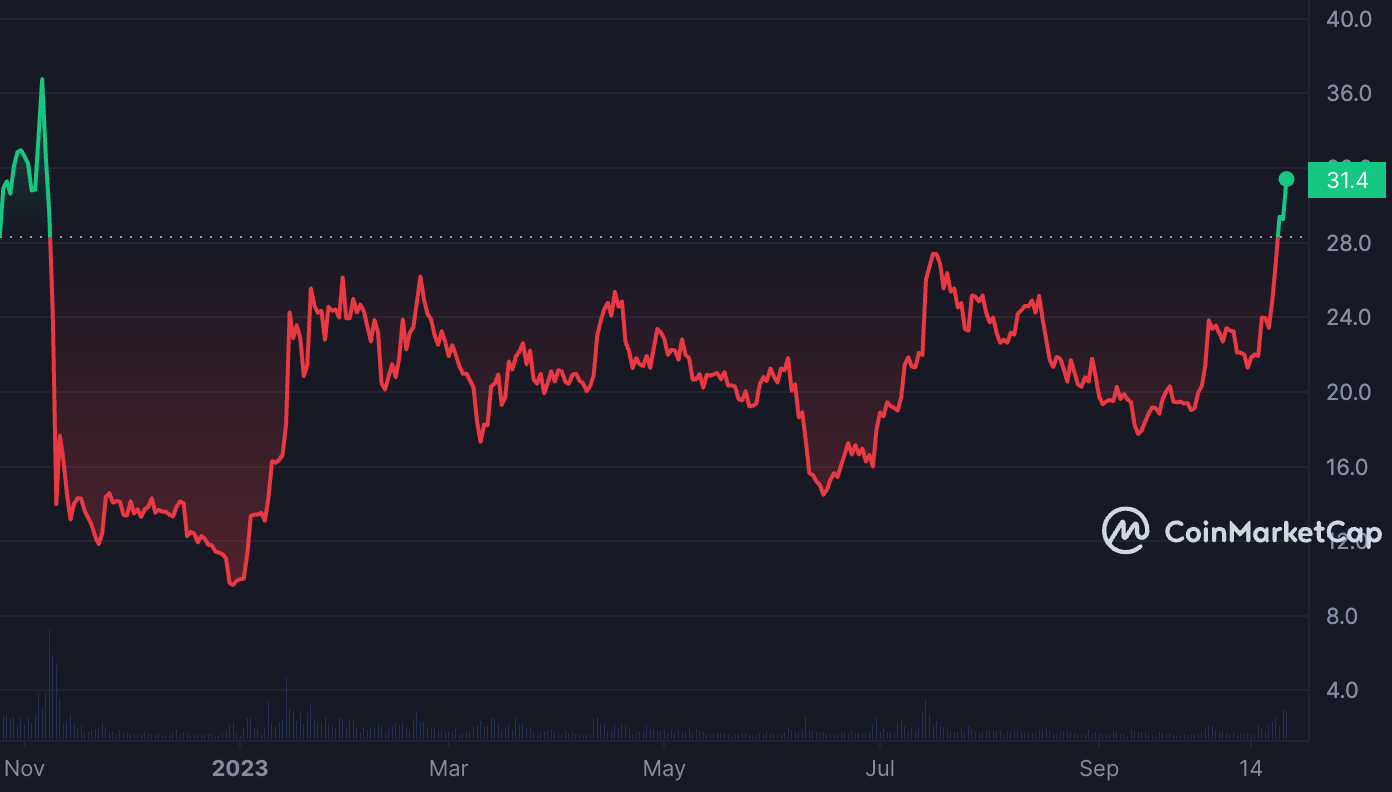
According to Messari’s data, Solana (SOL) experienced the highest growth among the top ten cryptocurrencies in terms of market value last month, with an increase of over 60%. This performance occurred amidst a broader recovery in the crypto market, as Bitcoin (BTC) and Ethereum (ETH) saw gains of 30% and 15% respectively during the same period.
Will the Rise in SOL Continue?
At the time of writing, SOL was priced at $32. According to CoinMarketCap, the altcoin last traded at this price level in November 2022. The recent upward momentum that has dominated the overall cryptocurrency market in the past few weeks has led to increased trading activity around SOL. According to data from analytics platform Santiment, the altcoin’s daily trading volume has increased by over 30% since October 16.
Furthermore, SOL transactions worth over $1 billion were completed in the past 24 hours, marking the highest daily trading volume since July. Momentum indicators observed on the daily chart revealed that SOL accumulation has significantly outpaced distribution among spot investors. For instance, the cryptocurrency’s relative strength index (RSI) and money flow index (MFI) were at 76.59 and 87.73 respectively at the time of writing.

On-Chain Analysis of SOL
These values indicate that buying activity surpasses profit-taking activity, thus indicating the continuation of the upward trend in SOL price. However, it should be noted that these indicators’ values also suggest that the altcoin is overbought and may need a correction.
The Chaikin Money Flow (CMF), which measures buying and selling pressure for the cryptocurrency, is at 0.10. A positive CMF value could be a strong sign of liquidity flow, which is much needed in the market. This could be a positive development, as increased liquidity supply facilitates buyers and sellers in the spot market to transact at desired prices, reducing price volatility.
Additionally, the average directional index of SOL confirmed the strength of the current upward trend. This suggests that SOL price is moving in a clear direction and there is significant bullish momentum behind the trend. The positive directional indicator at 40.60 is also above the negative directional indicator at 5.7. This indicates that buyers’ strength may outweigh sellers.


