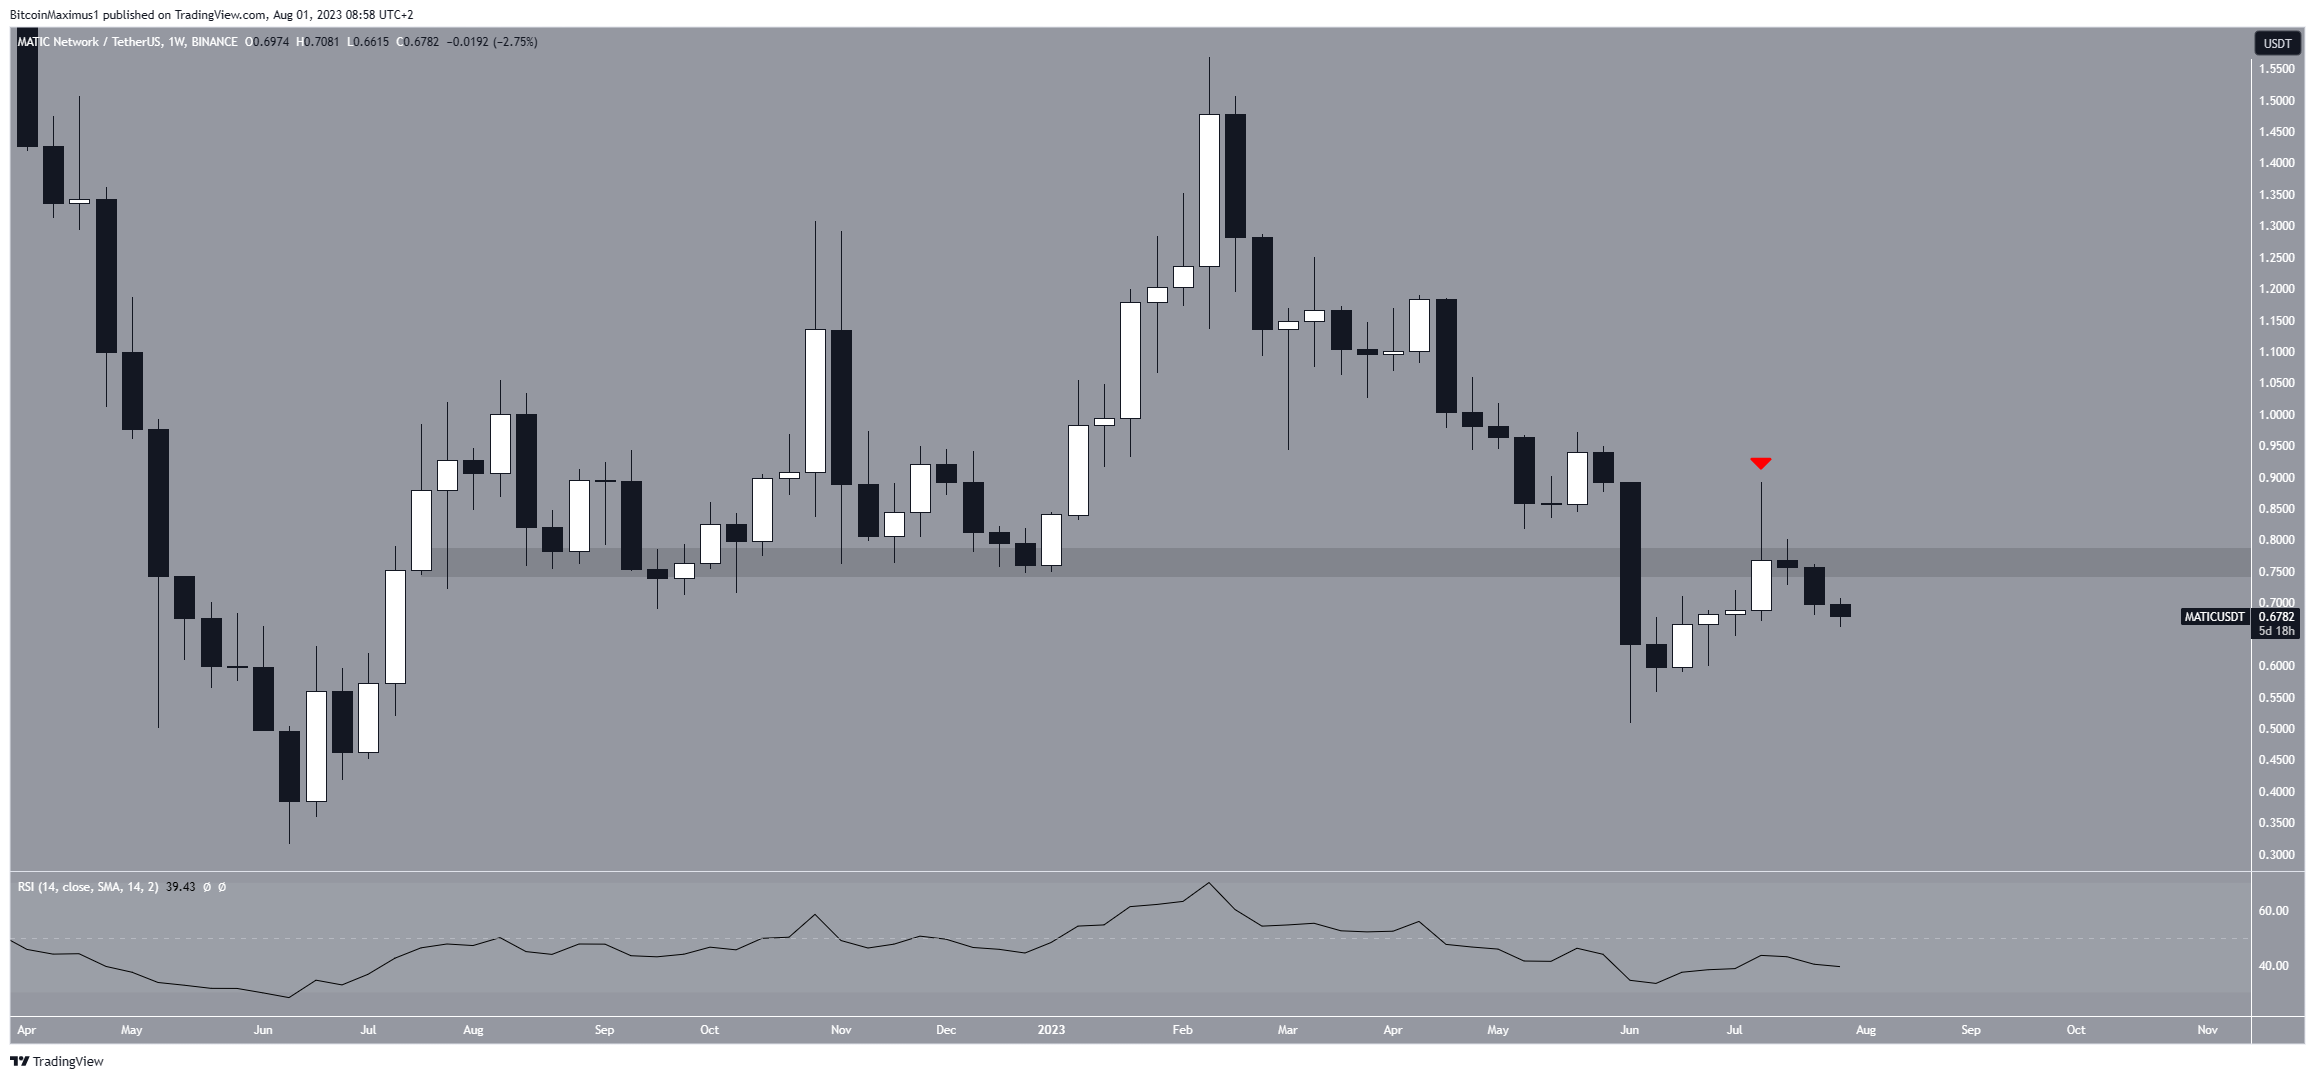
Polygon (MATIC) price has failed to break out of a significant horizontal resistance area and has since deviated from a short-term correction pattern. This could be a decisive sign that the trend is bearish. The breakout from the pattern could confirm the bearish trend and the downward movement could potentially lead to a new yearly low.
Negative Scenario for MATIC!
In the price analysis based on weekly time charts for MATIC, being rejected from the horizontal $0.80 resistance zone in recent times can indicate a pessimistic outlook. This zone has been acting as a support level since July 2022, but it has turned into a strong resistance for the price in the last two weeks.
Cryptocurrency rejection can be evident from the formation of a long upper wick, indicating increased selling pressure. This could show that despite the efforts of buyers to raise the price, sellers have taken control and caused MATIC to fall below the resistance zone.
The decline also coincided with digital banking giant Revolut delisting the MATIC token. Additionally, the weekly relative strength index (RSI) shows a downward trend. RSI is a momentum indicator used by investors to assess whether a market is overbought or oversold and to assist in making buying or selling decisions for a token.
When the RSI reading is above 50 and shows an upward trend, it can indicate a positive market sentiment and support the bulls. Conversely, when the reading falls below 50, it can indicate a downward trend along with an advantage for sellers. In this case, the RSI is currently below 50 and showing a downward trend. The daily analysis for MATIC also shows a bearish trend.

Will MATIC’s Decline Continue?
The main reason for the mentioned situation may be the break of an ascending parallel channel that has been in effect since June 10. The channel is considered a corrective pattern. Therefore, it could indicate that the upward correction is complete and the bearish trend is now continuing.
Additionally, the daily RSI shows a downward trend. The indicator legitimizes the decline by falling below 50 simultaneously with the price, indicating a bearish trend. Since the downward momentum, the MATIC price has declined by 7%.
If the decline continues, the next closest support could be at $0.60. This represents a 12% decline. Despite this bearish MATIC price prediction, if the price regains its balance, it could rise towards the support line of the channel.


