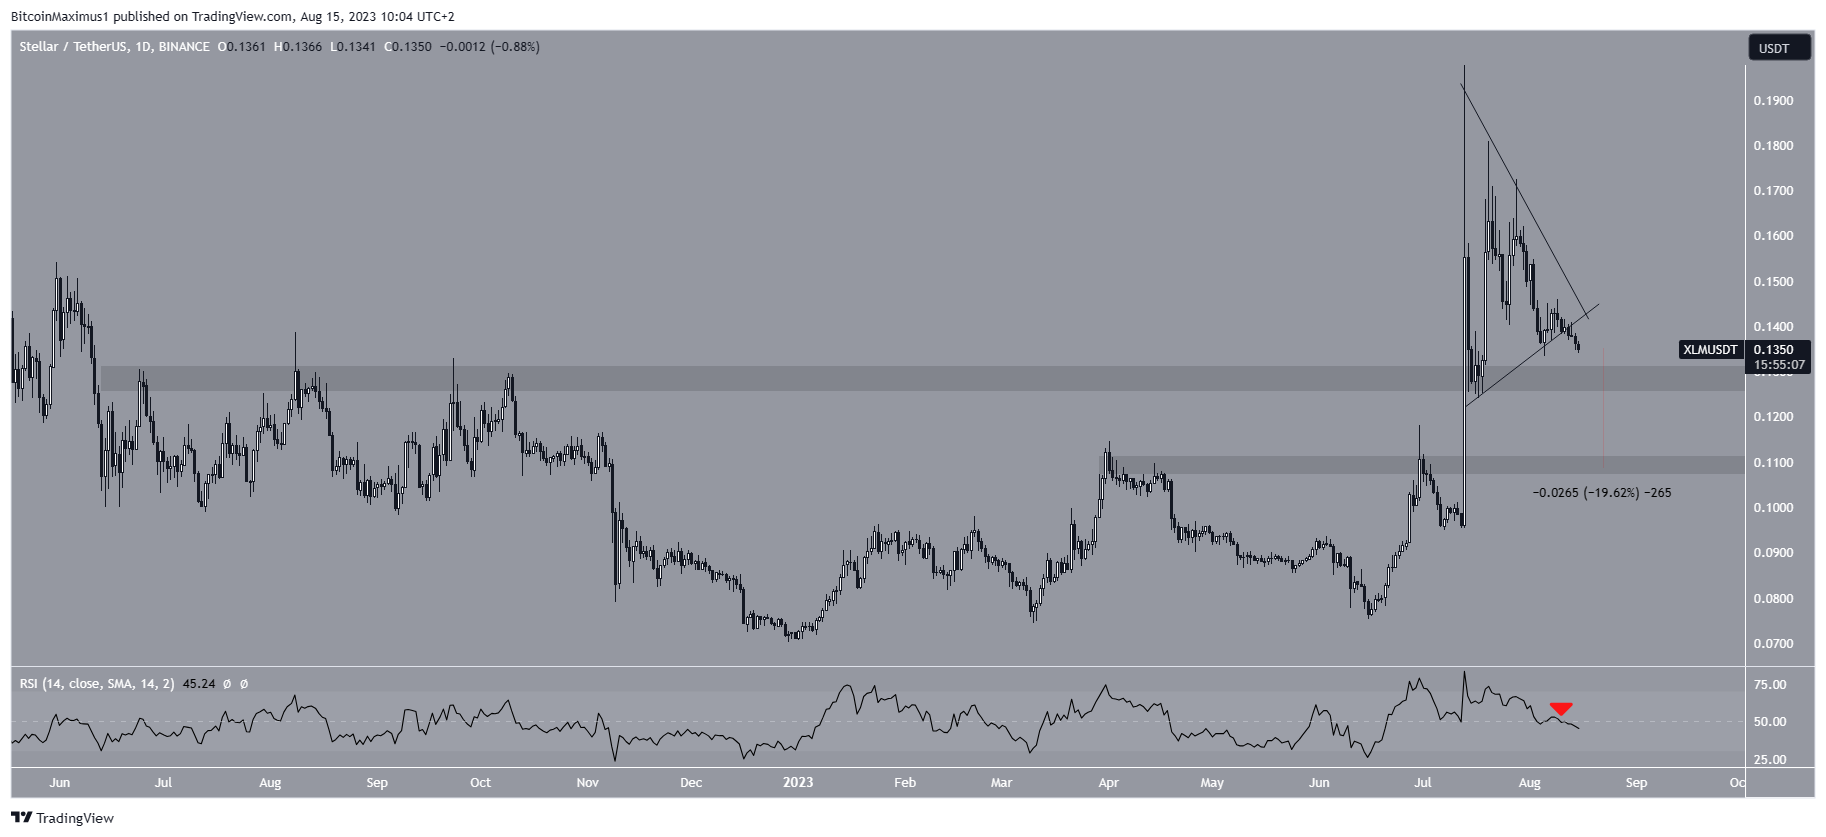
Stellar‘s (XLM) price has fallen since its yearly peak in July and is gradually approaching the main support area at $0.105. The daily timeframe price movement supports the decline as it shows a breakdown from a continuation pattern that was in effect last month. The weekly technical analysis timeframe indicates that XLM price has broken out from a 616-day resistance line in January. Departures from such long-term structures indicate the end of the previous trend and the start of a new trend in the opposite direction.
XLM Price Analysis!
Initially, XLM price struggled to rise above the $0.105 resistance area. However, it may have formed a higher low in June and then accelerated its upward momentum. In July, XLM broke the $0.105 resistance and reached a yearly high of $0.195. However, it has since turned downwards and created three consecutive weeks of bearish candlesticks.
The popular altcoin XLM may now be in the process of forming a fourth candlestick that could further accelerate the decline towards the $0.105 support area, which is expected to provide strong support. The main resistance area at $0.230 is currently over 70% above the current price, while the $0.105 support area is 22% below it. The weekly RSI provides an inconclusive result.
Investors use RSI as a momentum indicator to assess whether a market is overbought or oversold and help make buying or selling decisions. When the reading crosses above 50 with an ascending pattern, it may indicate that the bullish stance is continuing. Conversely, readings below 50 indicate a bearish sentiment.

The Future of XLM Coin!
Despite the declining RSI, the indicator remains above 50. These conflicting signals do not confirm the direction of the trend. A closer look at the daily timeframe analysis reveals that the price may continue to decline. The fundamental reason for this is the recent breakout of XLM from a symmetrical triangle. A symmetrical triangle is considered a neutral pattern.
However, since it emerged after an upward movement, its continuation and breakout were expected. Despite this probable scenario, XLM broke out of the triangle and has fallen in the past three days. XLM is currently slightly above the $0.130 support area. The daily RSI supports the validity of the breakdown as the indicator has fallen below 50.
In conclusion, if XLM price falls below $0.130, it could drop to the next support at $0.110. This would represent a 20% decrease from the current price. The area also aligns with the long-term support previously mentioned at $0.105.

 Türkçe
 Español


