Türkçe
 Español


XRP created a strong turmoil by reacting to the allegations that it liquidated its $377 million position in Bitcoin, which is considered to be the result of Elon Musk’s Tesla. Moreover, the crypto market did not sit well with the Federal Open Market Committee (FOMC) minutes, which indicated further interest rate hikes to prevent inflation.
Lewis Harland, a trader at Decentral Park Capital, emphasized that US interest rates have reached the highest levels in recent years. It was stated that the 10-year yield also reached the highest level in 15 years. He also stated that if this selling continues in bonds, negative price movements in risk assets may continue until the weekend.
XRP Coin Review
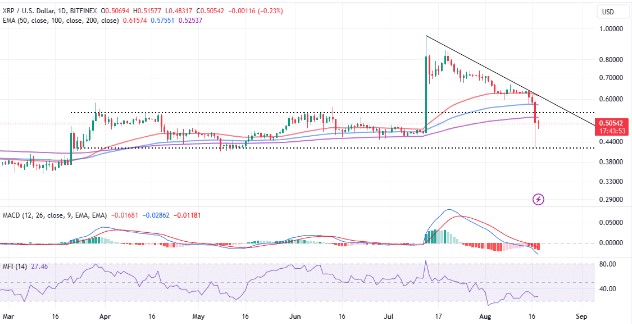
The least resistant path is standing in the lower region supported by increased short positions attributed to negative sensitivity. The sell signal from Moving Average Convergence Divergence (MACD) manifested itself when the blue MACD line crossed below the red signal line.
Net negative fund outflows from XRP markets also contributed to selling pressure. According to the Money Flow Index (MFI), the volume of fund outflows from XRP markets is currently in effect, which seems to further weaken attempts to sustain the uptrend to $1.
XRP trading below all major moving averages starting with the 50-day EMA (red), 100-day EMA (blue), and 200-day EMA (purple) indicates that bears are intensifying their control and may push for further losses below the $0.42 support.
How Much is XRP?
XRP investors may have also overreacted to the Securities and Exchange Commission’s (SEC) partial appeal for the lawsuit against Ripple. The appeal requests the court to reconsider its decision that programmatic XRP sales on third-party platforms are not securities, unlike direct sales to institutions.
Judge Analisa Torres accepted the SEC’s request and gave the institution until August 18 to submit its appeal. Ripple has until September 1 to submit its appeal, but this period can be extended until September 8.
Considering that the Relative Strength Index (RSI) is considered oversold, a recovery can occur at any time. The four-hour chart shows that the RSI is at 18.26 after rising from levels below 10.00.
Investors looking to bet on new long positions in XRP may want to wait for the price to overcome the $0.51 hurdle, which can confirm a recovery and target high prices of $0.62. The uptrend can be confirmed by RSI crossing above the yellow signal line.