The topic of this week in the cryptocurrency markets has been the US macroeconomic data and the Fed’s interest rate decision. In addition to all of this, the emphasis of Fed officials on the decision to raise interest rates in the future has led Bitcoin investors to engage in spot selling. On the Ethereum side, despite the approval of the first ETF, this situation has not had the desired impact.
Ethereum Chart Analysis
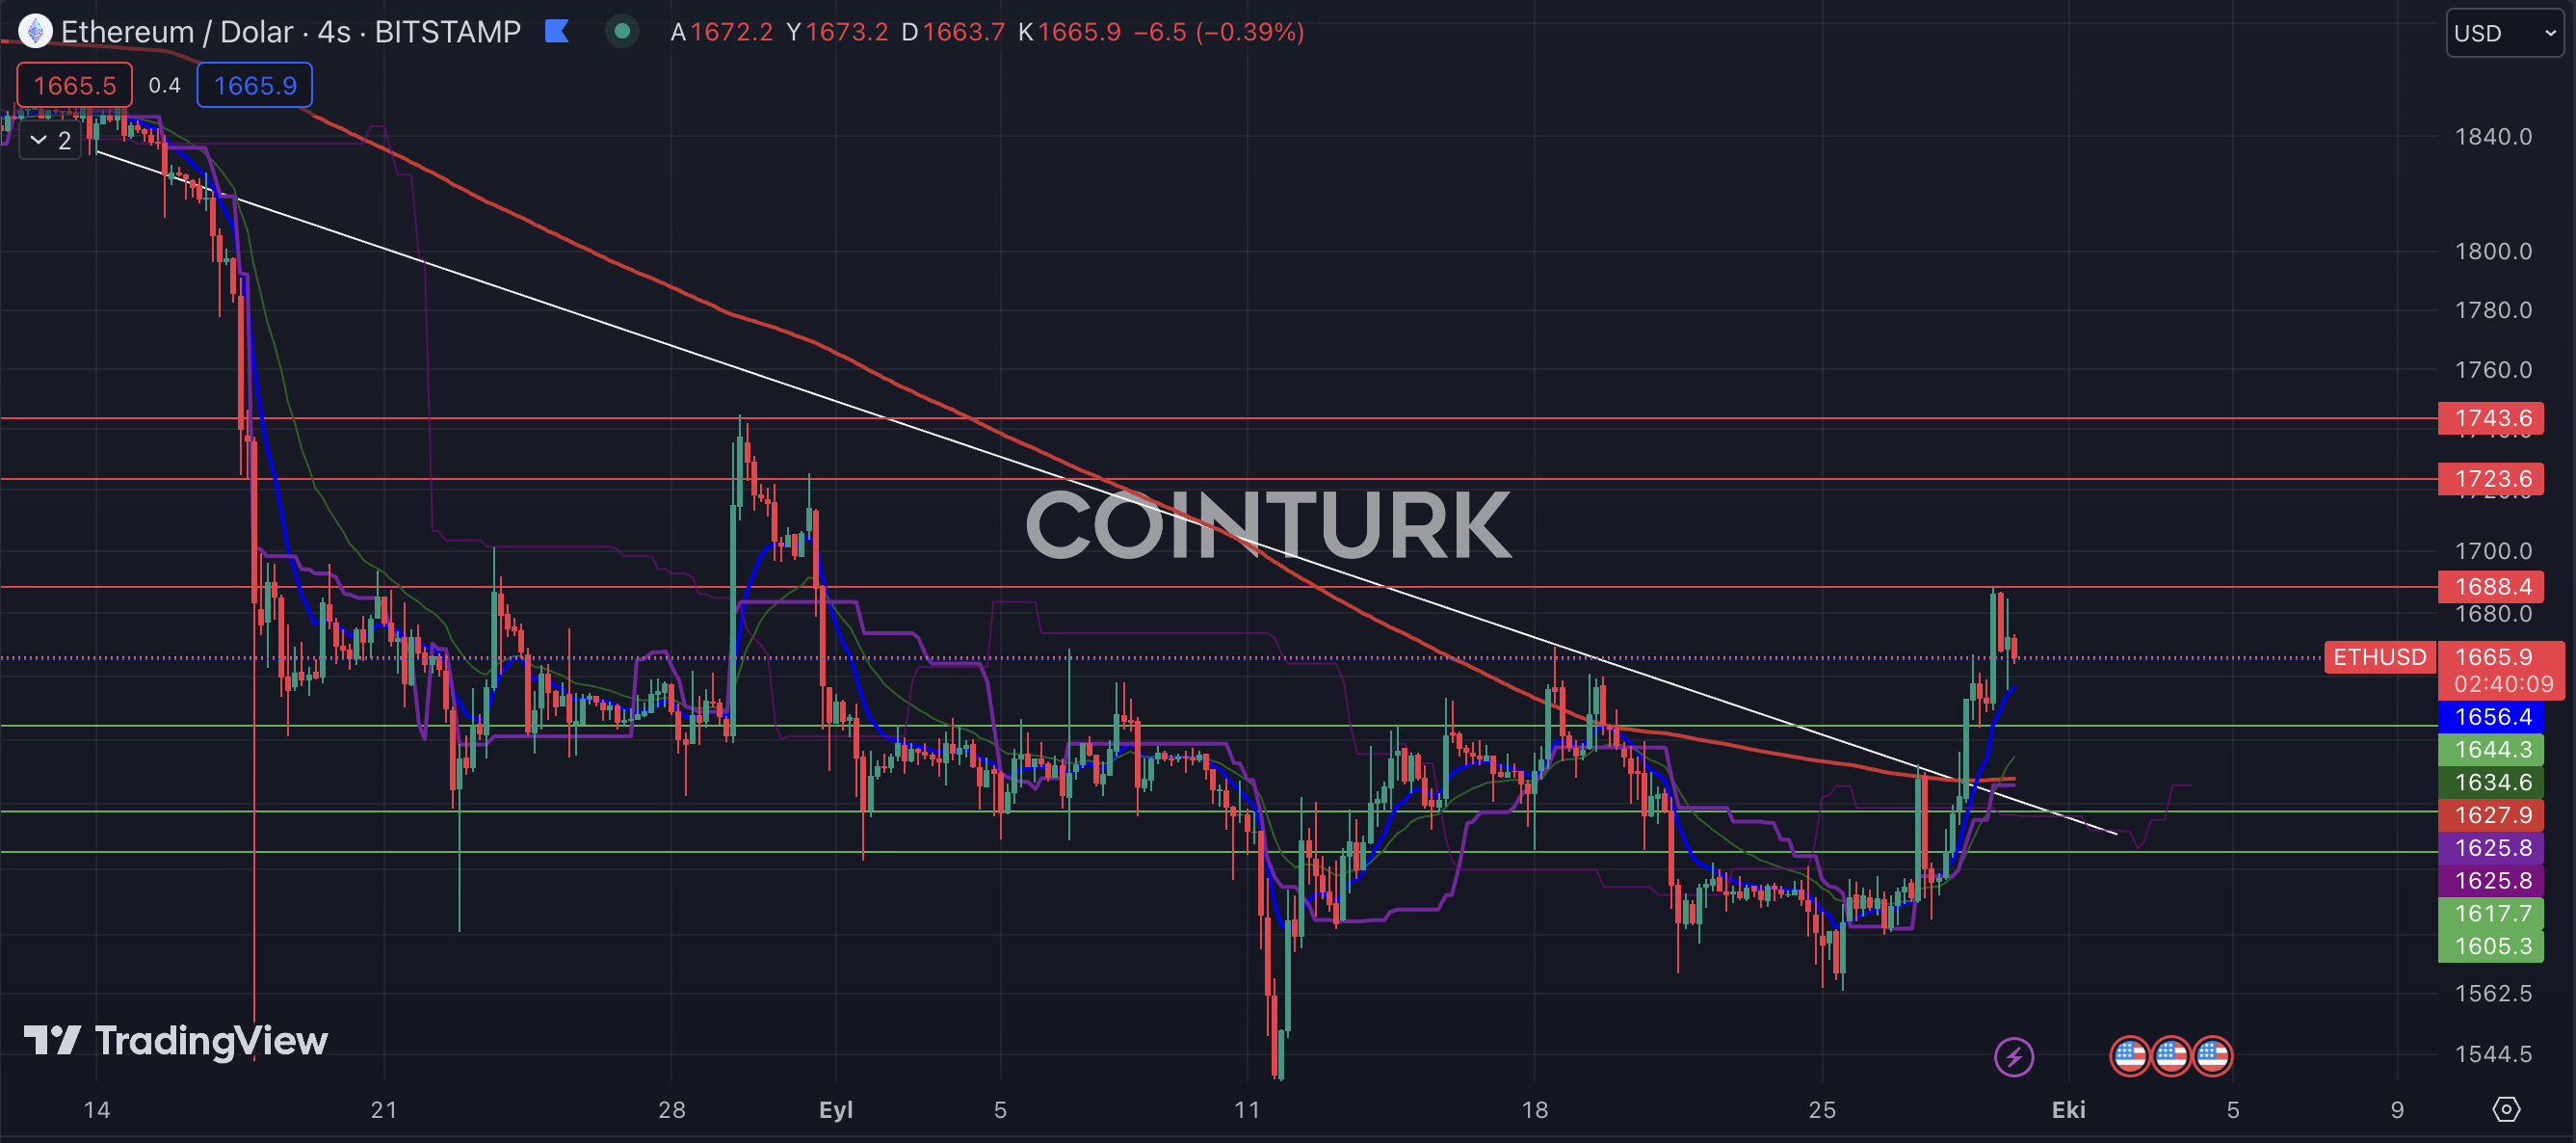
Ethereum, which broke the downtrend in the four-hour chart analysis, started to see selling again in the recent bars. This situation may be due to spot investors taking profit. It is important for investors to see that in such structures, the line that serves as resistance after the downtrend is broken also functions as support, especially in traditional markets. Therefore, it would not be surprising to see a significant sell-off in the Ethereum price.
The important support levels to be considered in the four-hour Ethereum chart are respectively $1644, $1617, and $1605. In particular, if a four-hour bar closes below the $1617 level, it will cause both the EMA 7, EMA 21, and EMA 200 averages to remain below and the failure of the trend breakout.
The resistance levels to be followed are respectively $1688, $1723, and $1743. Since the $1688 level formed a double top in the recent rally, breaking this level in the short term is important for the Ethereum price.

Notable Formation in ETH/BTC Pair
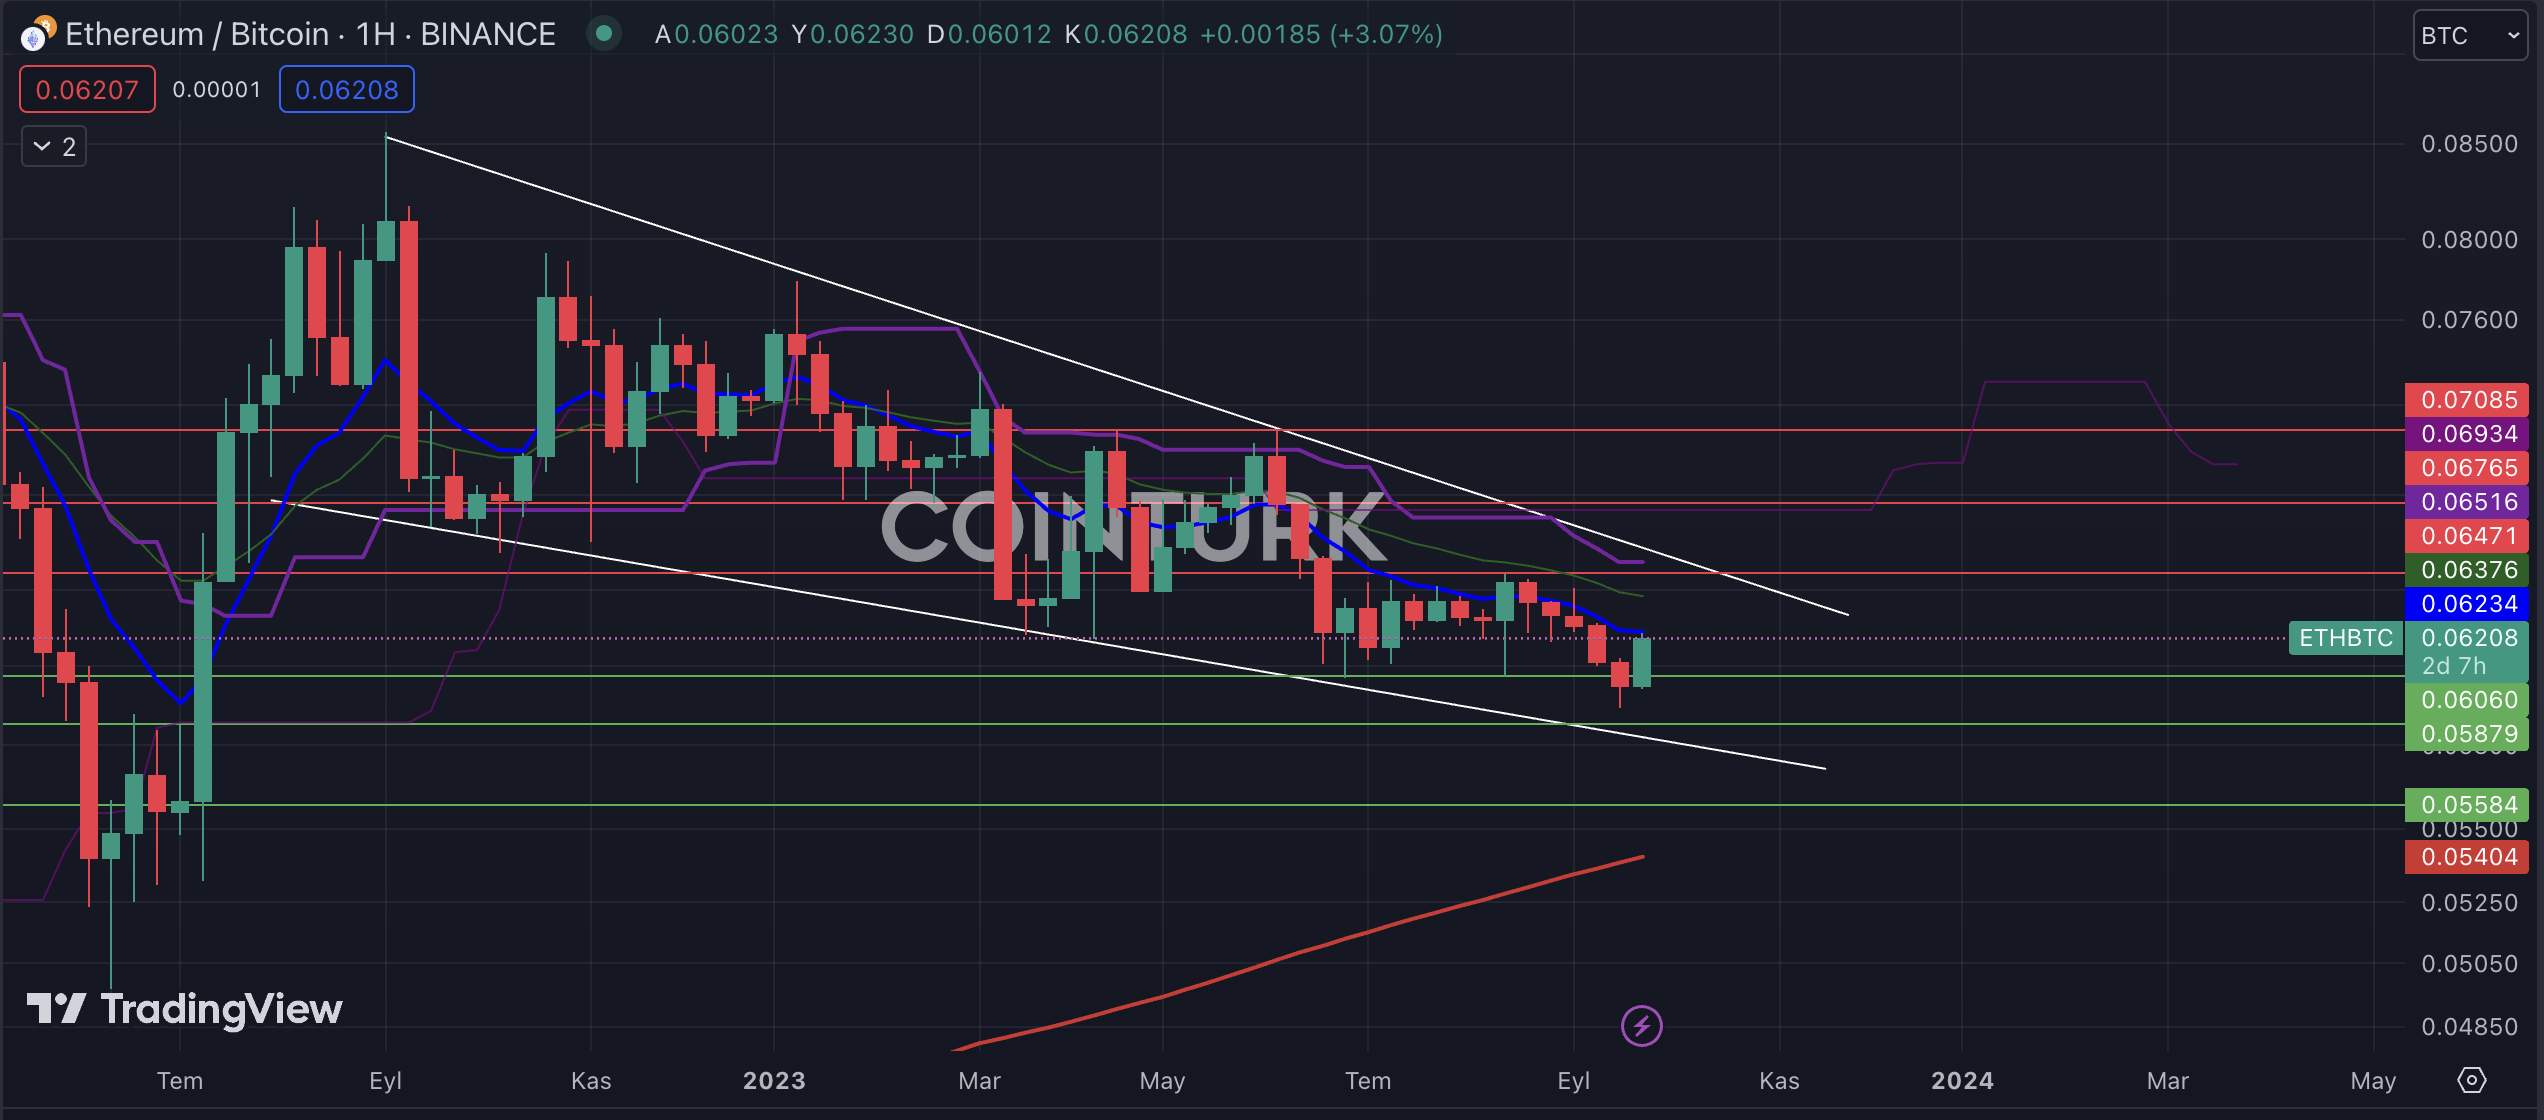
The ETH/BTC pair, which many analysts closely follow, measures the pulse of the altcoin market, especially Ethereum. An increase in this ratio indicates that Ethereum is gaining more value against Bitcoin, while a decrease indicates that Ethereum is losing value against Bitcoin. The descending wedge formation formed on the weekly chart continues to tighten day by day.
The important support levels to be considered for ETH/BTC are respectively 0.060, 0.058, and 0.055. In particular, a weekly bar closure below the 0.055 level will cause the wedge to work in a downward direction and Ethereum to lose value against Bitcoin.
The resistance levels to be followed for ETH/BTC are respectively 0.064, 0.067, and 0.070. Especially, if a bar closure above the 0.067 level occurs, it will cause the wedge formation to work in an upward direction and Ethereum to gain value against Bitcoin.


