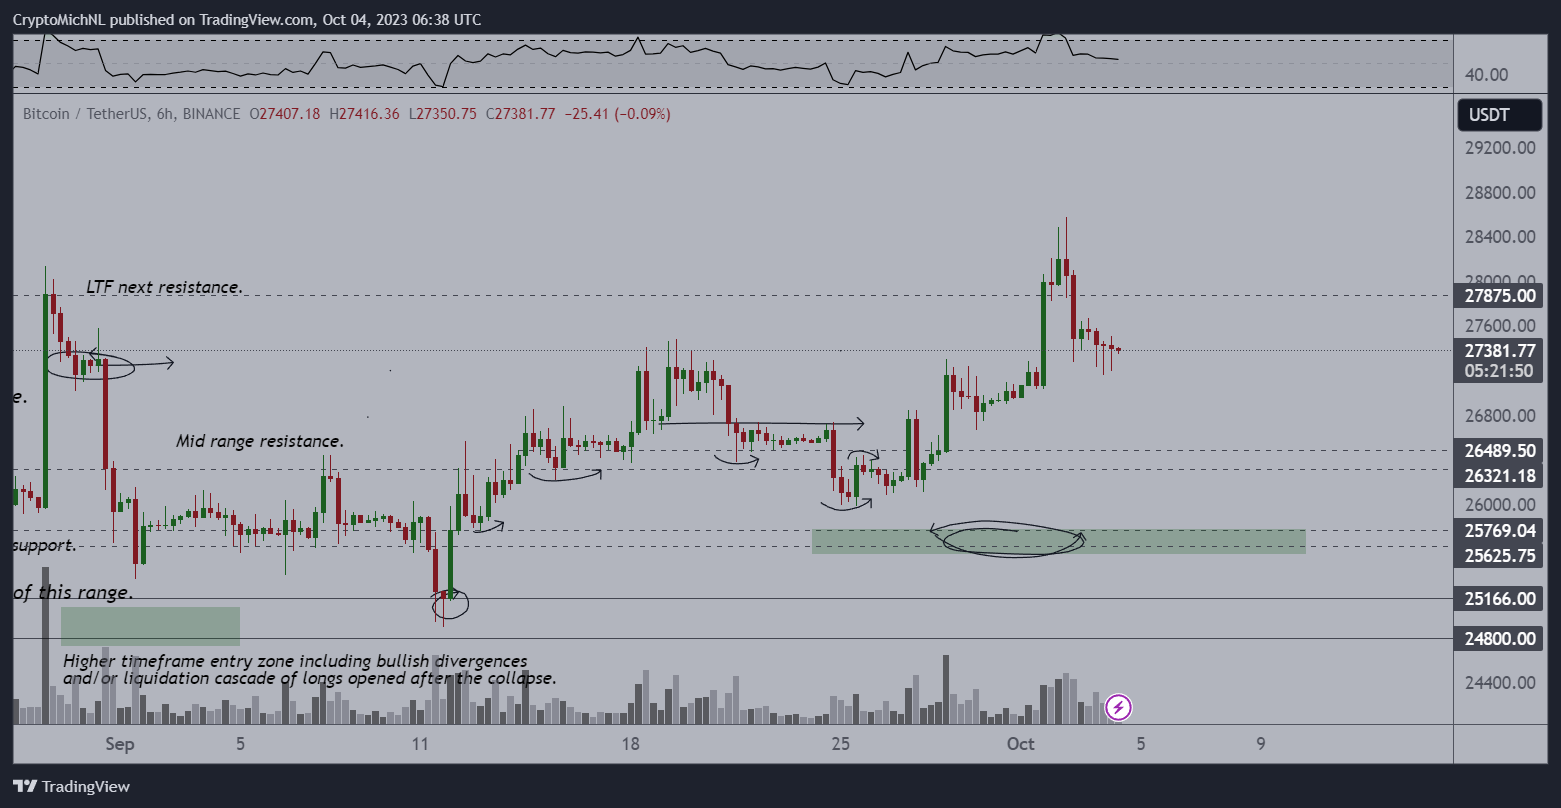
Bitcoin, once again, failed to hold onto the $28,000 level it attempted this week. After a rise following the opening of Wall Street, Bitcoin’s attempt to reach its highest level in six weeks was unsuccessful. Renowned analyst Michael van de Poppe stated that Bitcoin could surpass the $30,000 resistance level, but emphasized the possibility of a retest between $26,700 and $26,900.
Bitcoin Unable to Break the $28,000 Resistance
According to data from TradingView, investors were aiming to reach the levels at the beginning of the week, but Bitcoin experienced a 2.5% loss shortly after surpassing the $28,000 level, resulting in a $700 loss within an hour.
Material Indicators provided an interesting comment about this decline. The team expecting a decline mentioned that they had previously issued a warning and shared the following statement:
“If you haven’t seen this rejection coming, you may want to evaluate your tools as both TA and Trend Precognition indicate a high probability of rejection. However, this doesn’t mean we won’t see another attempt because we probably will.”
In continuation of the post, Keith Alan, co-founder of Material Indicators, drew attention to a potential trading range for the BTC/USD pair. He pointed out the significance of the current spot range in previous bullish markets:
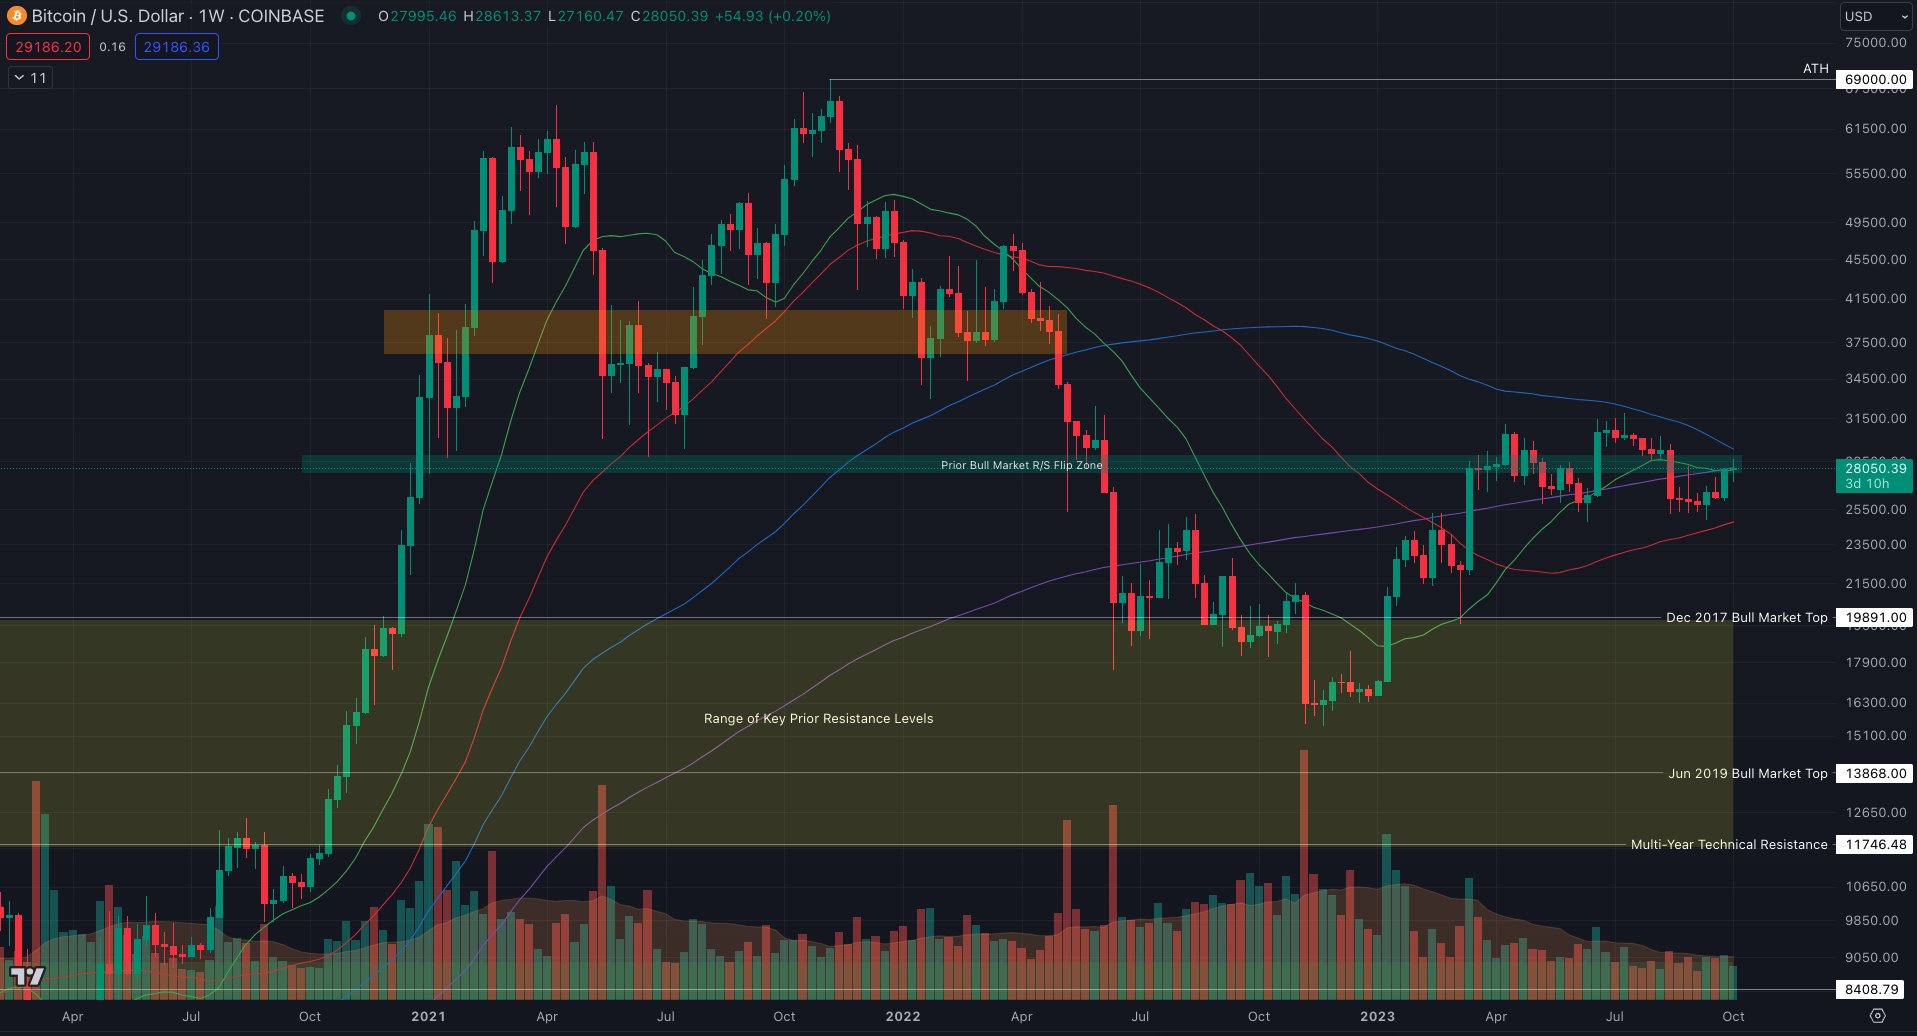
“So far, the Moving Averages have served as strong technical resistance or support. Breaking through this range is a possibility for this month. If this happens, many people will suffer losses along the way. A close above the 200-week MA will fuel hopes for an uptrend. However, a close below the 21-week MA will keep BTC between $25,000 and $28,000.”

Analysts Share Their Thoughts on a Scale of X
Renowned investor and analyst Michael van de Poppe stated that Bitcoin is ready to surpass the $30,000 resistance. He shared his thoughts with his followers through an X post on October 4:
“It will be crucial to hold above $27,200 to continue upward, but preferably a retest between $26,700 and $26,900 can occur before continuing to rise.”

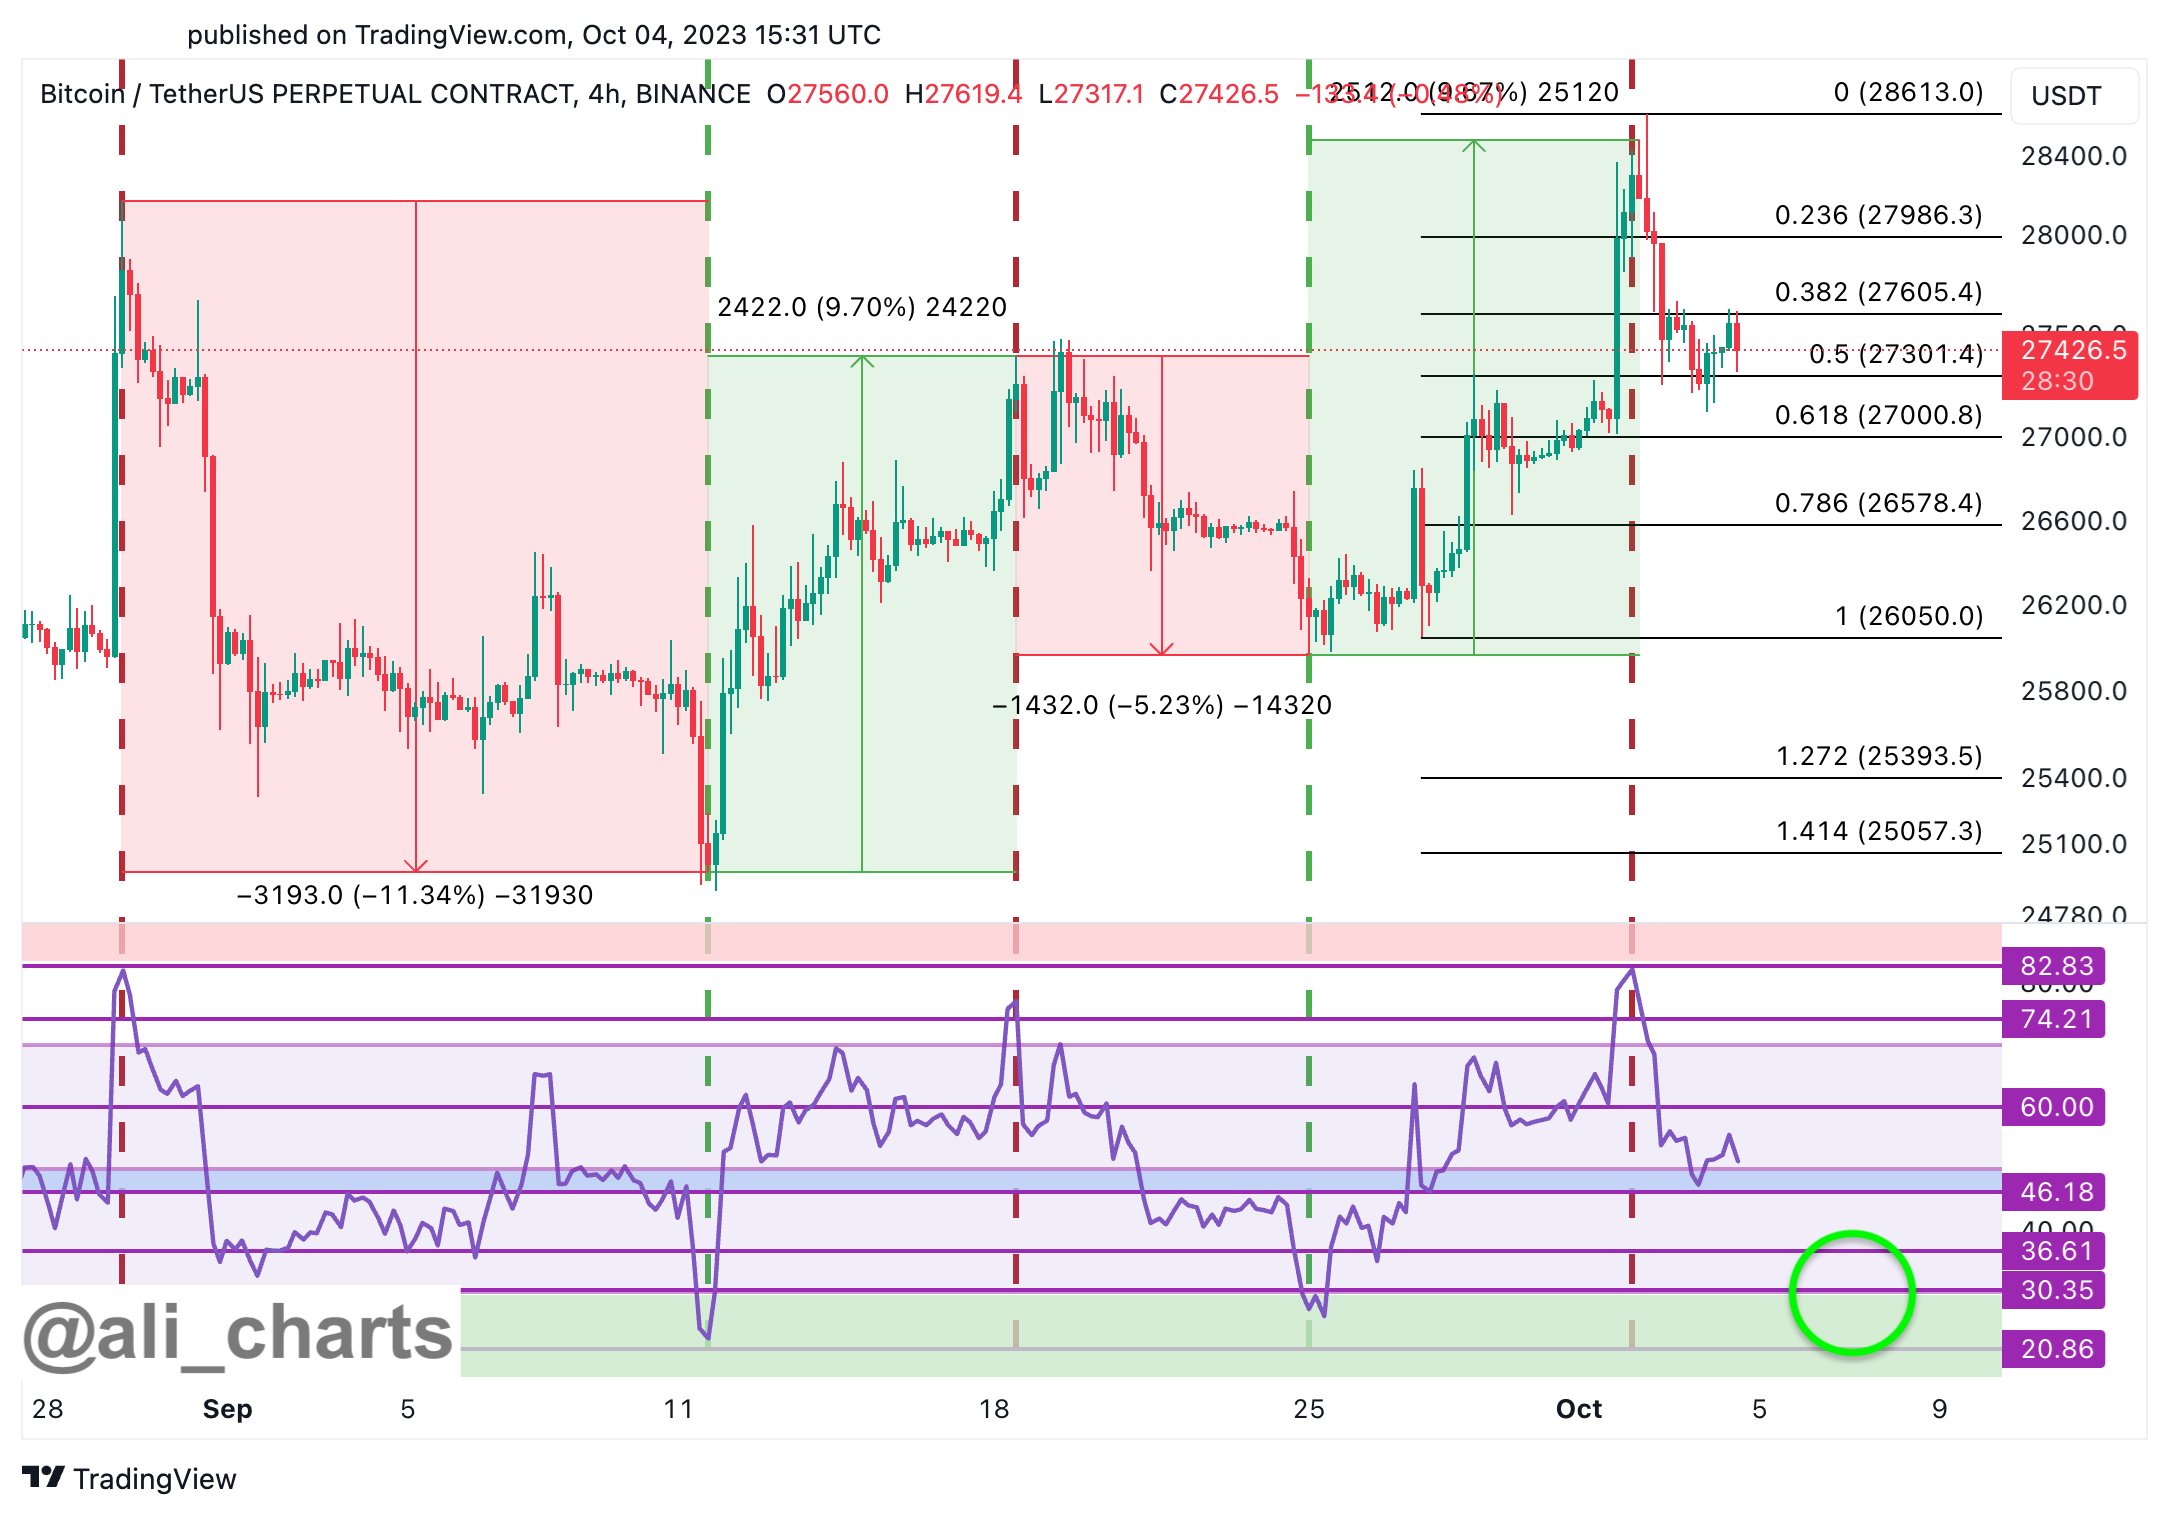
Another popular analyst and investor, Ali, shared his own analysis of lows and highs with his followers through X. He drew attention to the Relative Strength Index (RSI), which fluctuated between approximately 30 and 75 from the end of August until today, in four-hour time frames:
“Currently, the RSI is at the 51 level. Patience is crucial! It might be best to wait for the RSI to drop below 30 or 35 to buy the dip.”
Ali also shared a graph on X, highlighting a classic sell signal that occurred at the beginning of October, implying that the BTC price is low compared to those times and a new buy signal may emerge.


 Türkçe
 Español


Btc