Bitcoin and the positive news flow in the cryptocurrency market have led to a surge in meme tokens following the altcoin market. According to the data from the cryptocurrency price platform Coingecko, the market value of meme tokens inspired by meme culture has increased by 15% in the past seven days, reaching a total market value of over $16 billion. So, what is happening with three meme tokens that are particularly followed by Turks? Let’s take a closer look.
Dogecoin Chart Analysis
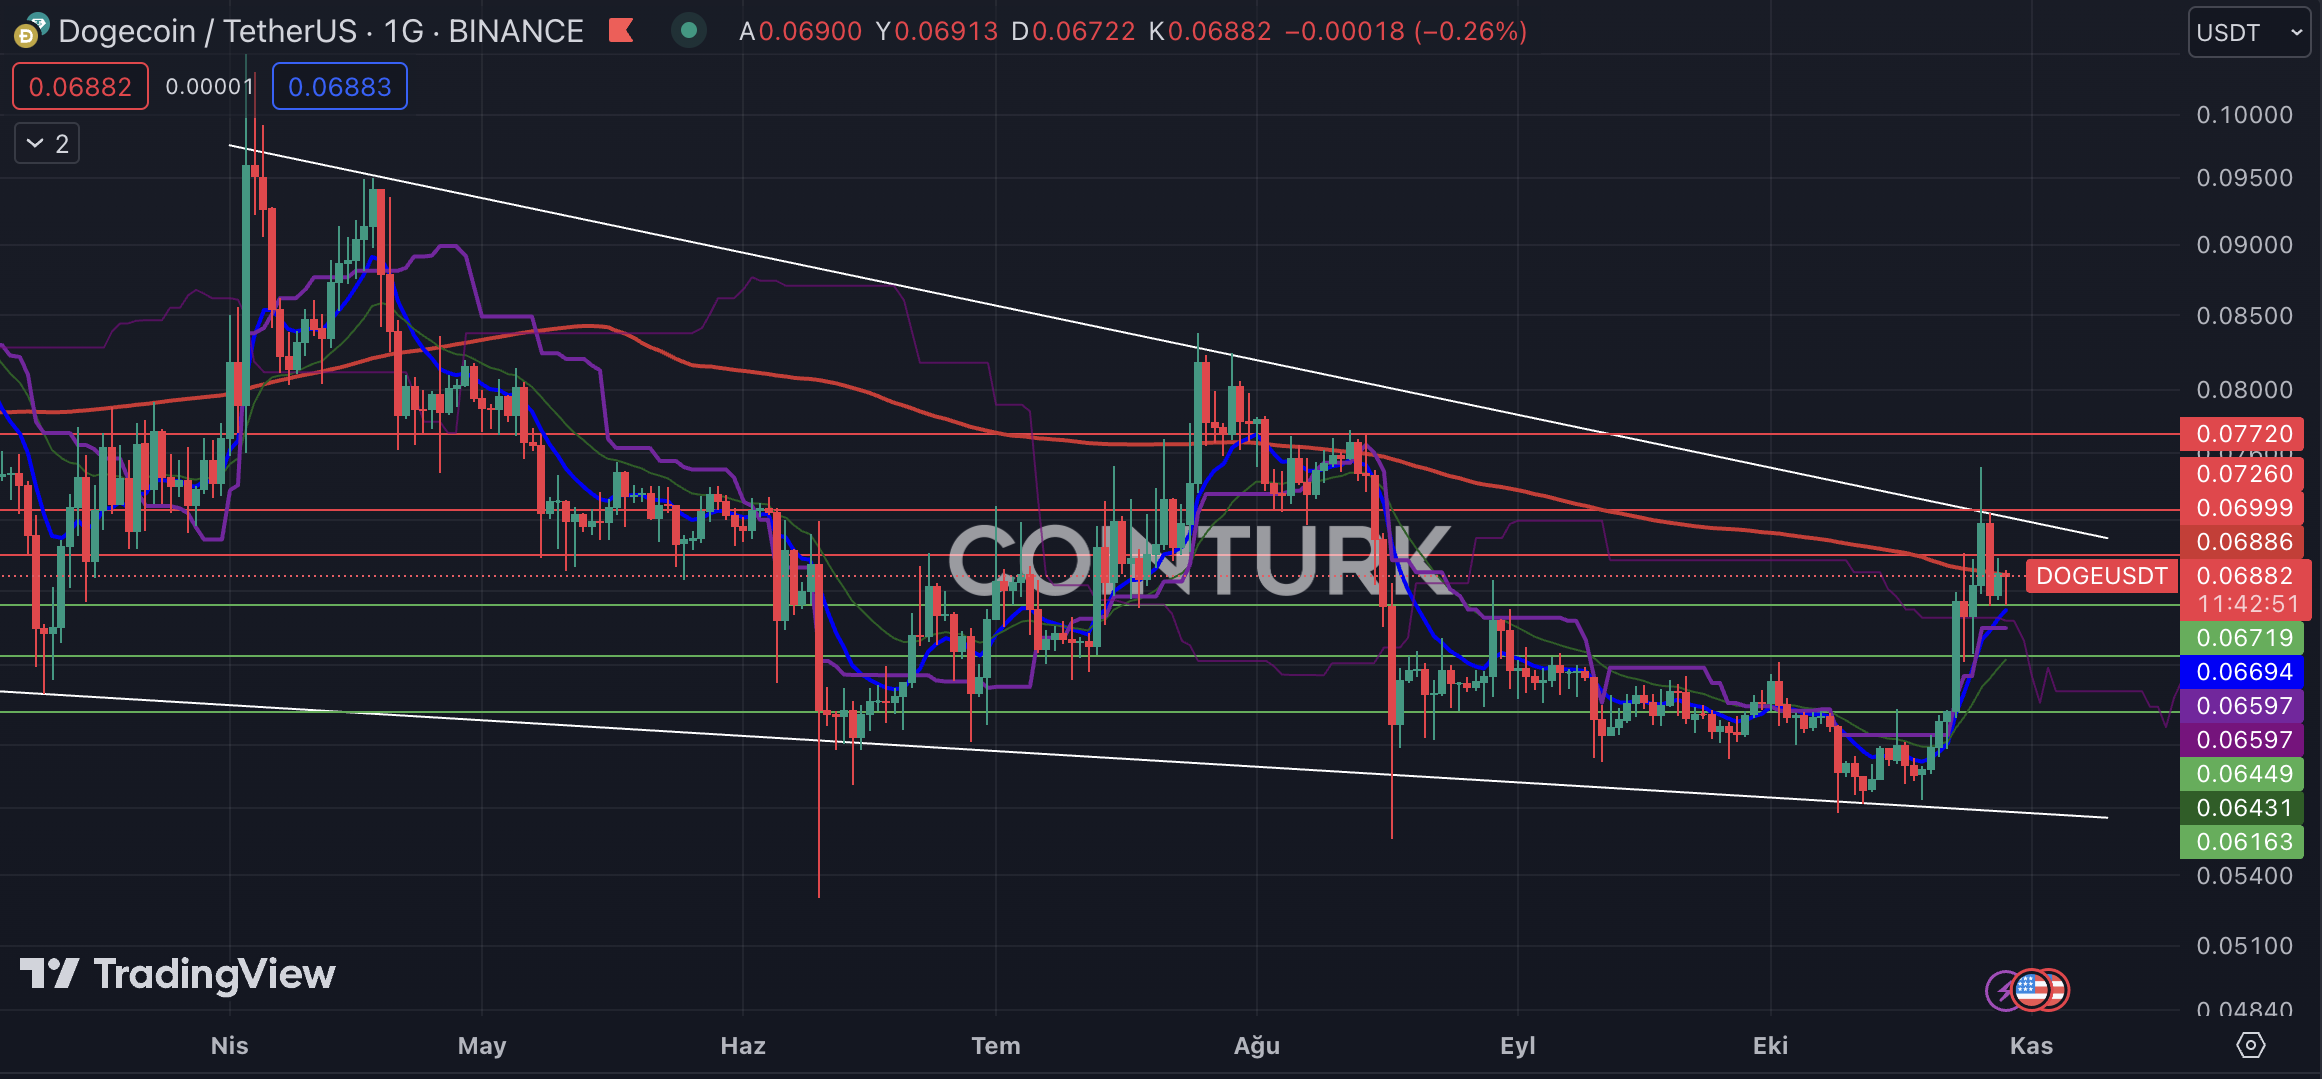
Dogecoin, the most valuable meme token project associated with Elon Musk, attracts attention with its wedge structure on the daily chart. Based on the structure since April, DOGE has recently been rejected from the resistance line and is currently heading downwards. The battle at the EMA 200 level will determine the direction of this breakout.
The support levels that should be followed for DOGE are respectively; $0.06719, $0.06449, and $0.06163. Especially if the daily bar closes below the $0.06719 level, it may put the bullish scenario on hold for now. The resistance levels to be monitored for DOGE are respectively; $0.06999, $0.07260, and $0.07720.
Shiba Inu Chart Analysis
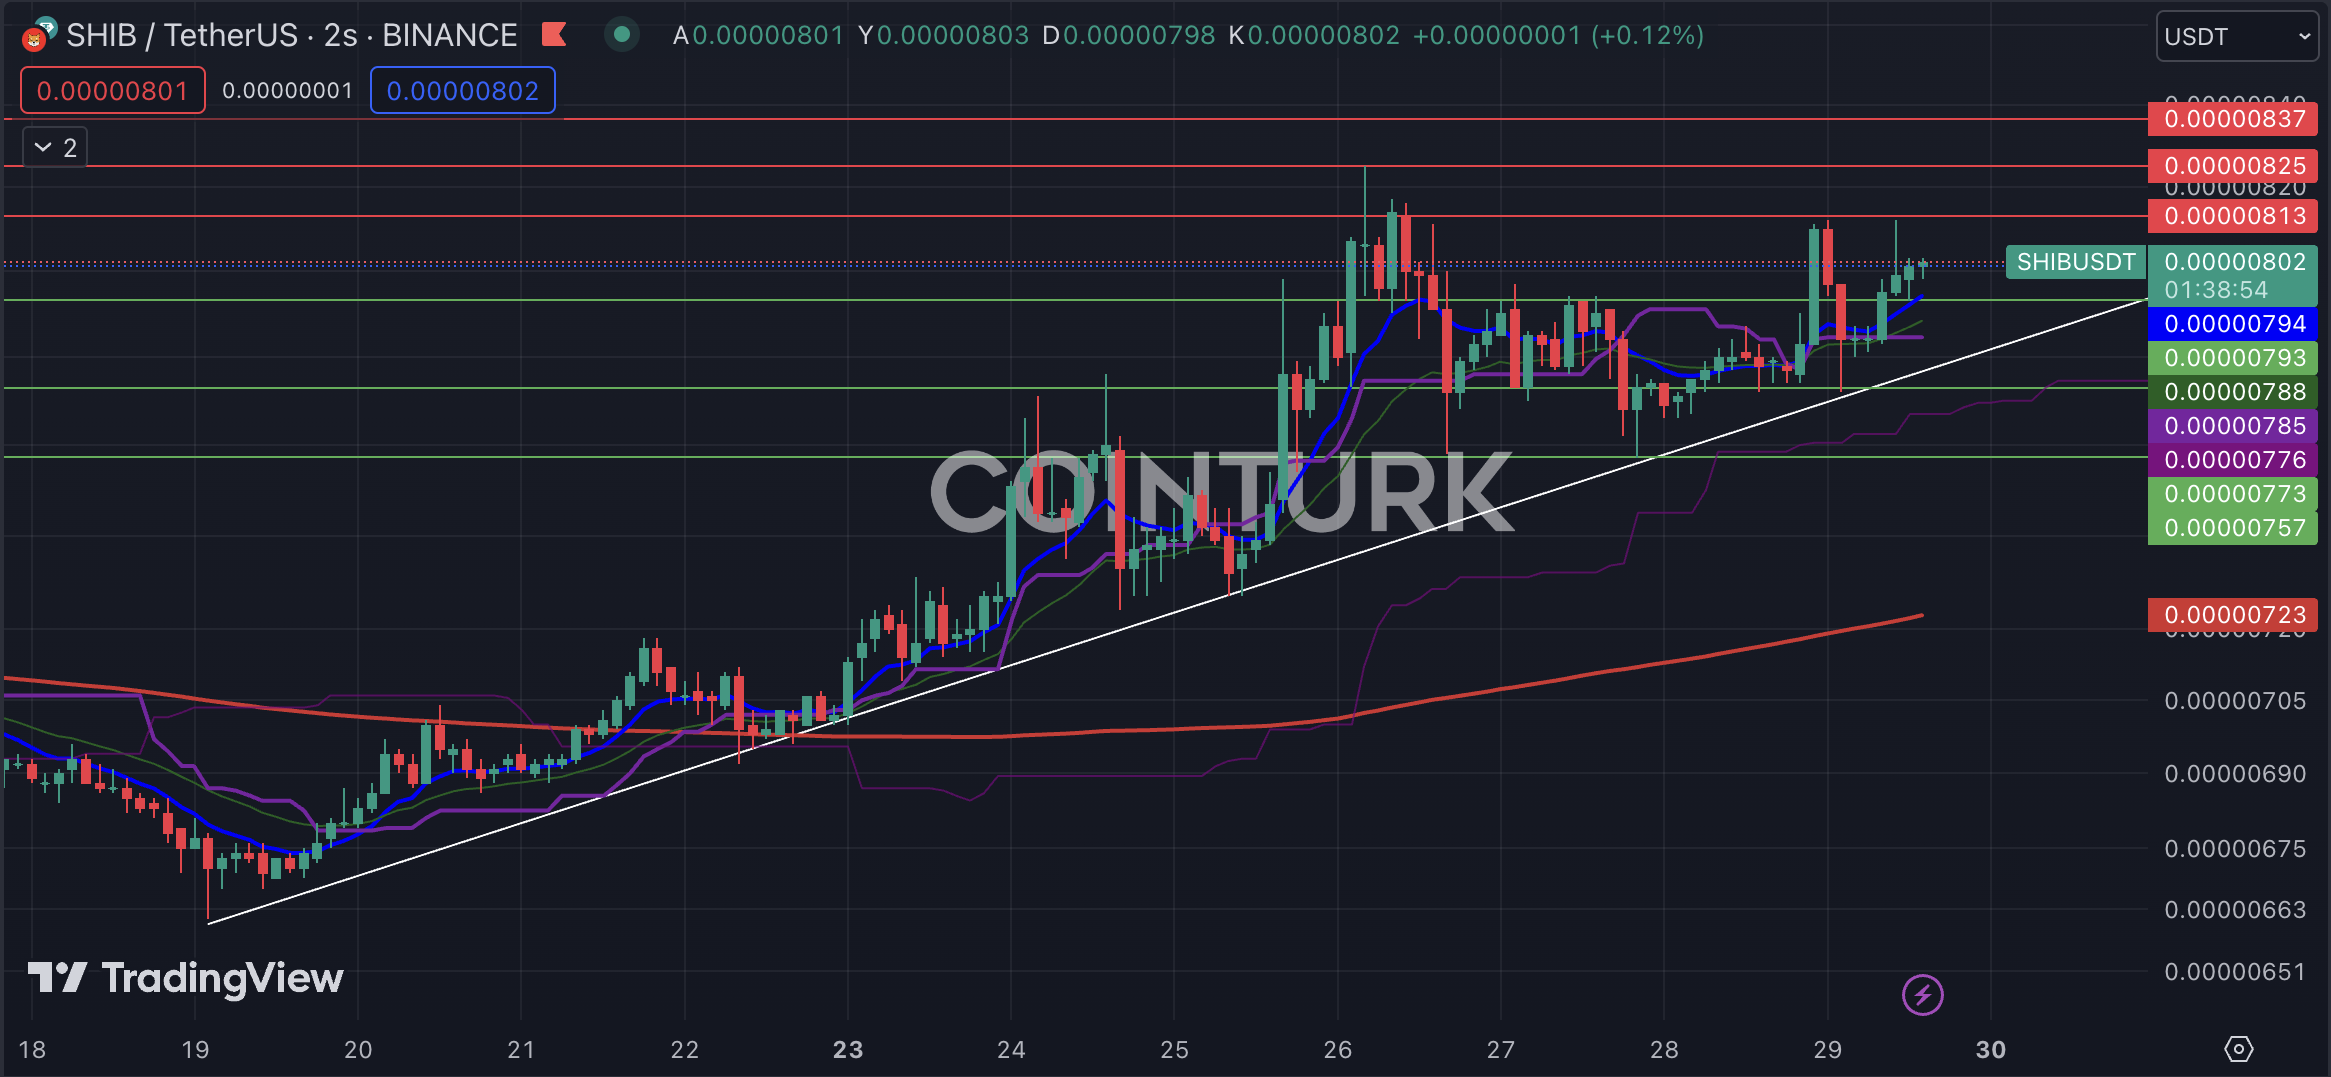
Shiba Inu, another meme token that Turkish cryptocurrency investors follow closely, has experienced a significant upward momentum in recent days. The high volatility on the two-hour chart only leads to the formation of a structure on the resistance line, and things are going well for SHIB in the short term, as it moves above many average levels.
The support levels that should be followed for SHIB are respectively; $0.00000793, $0.00000773, and $0.00000757. Especially if the two-hour bar closes below the $0.00000773 level, it may cause a break in the support line and a price drop. The resistance levels to be noted for SHIB are respectively; $0.00000813, $0.00000825, and $0.00000837.
Floki Chart Analysis
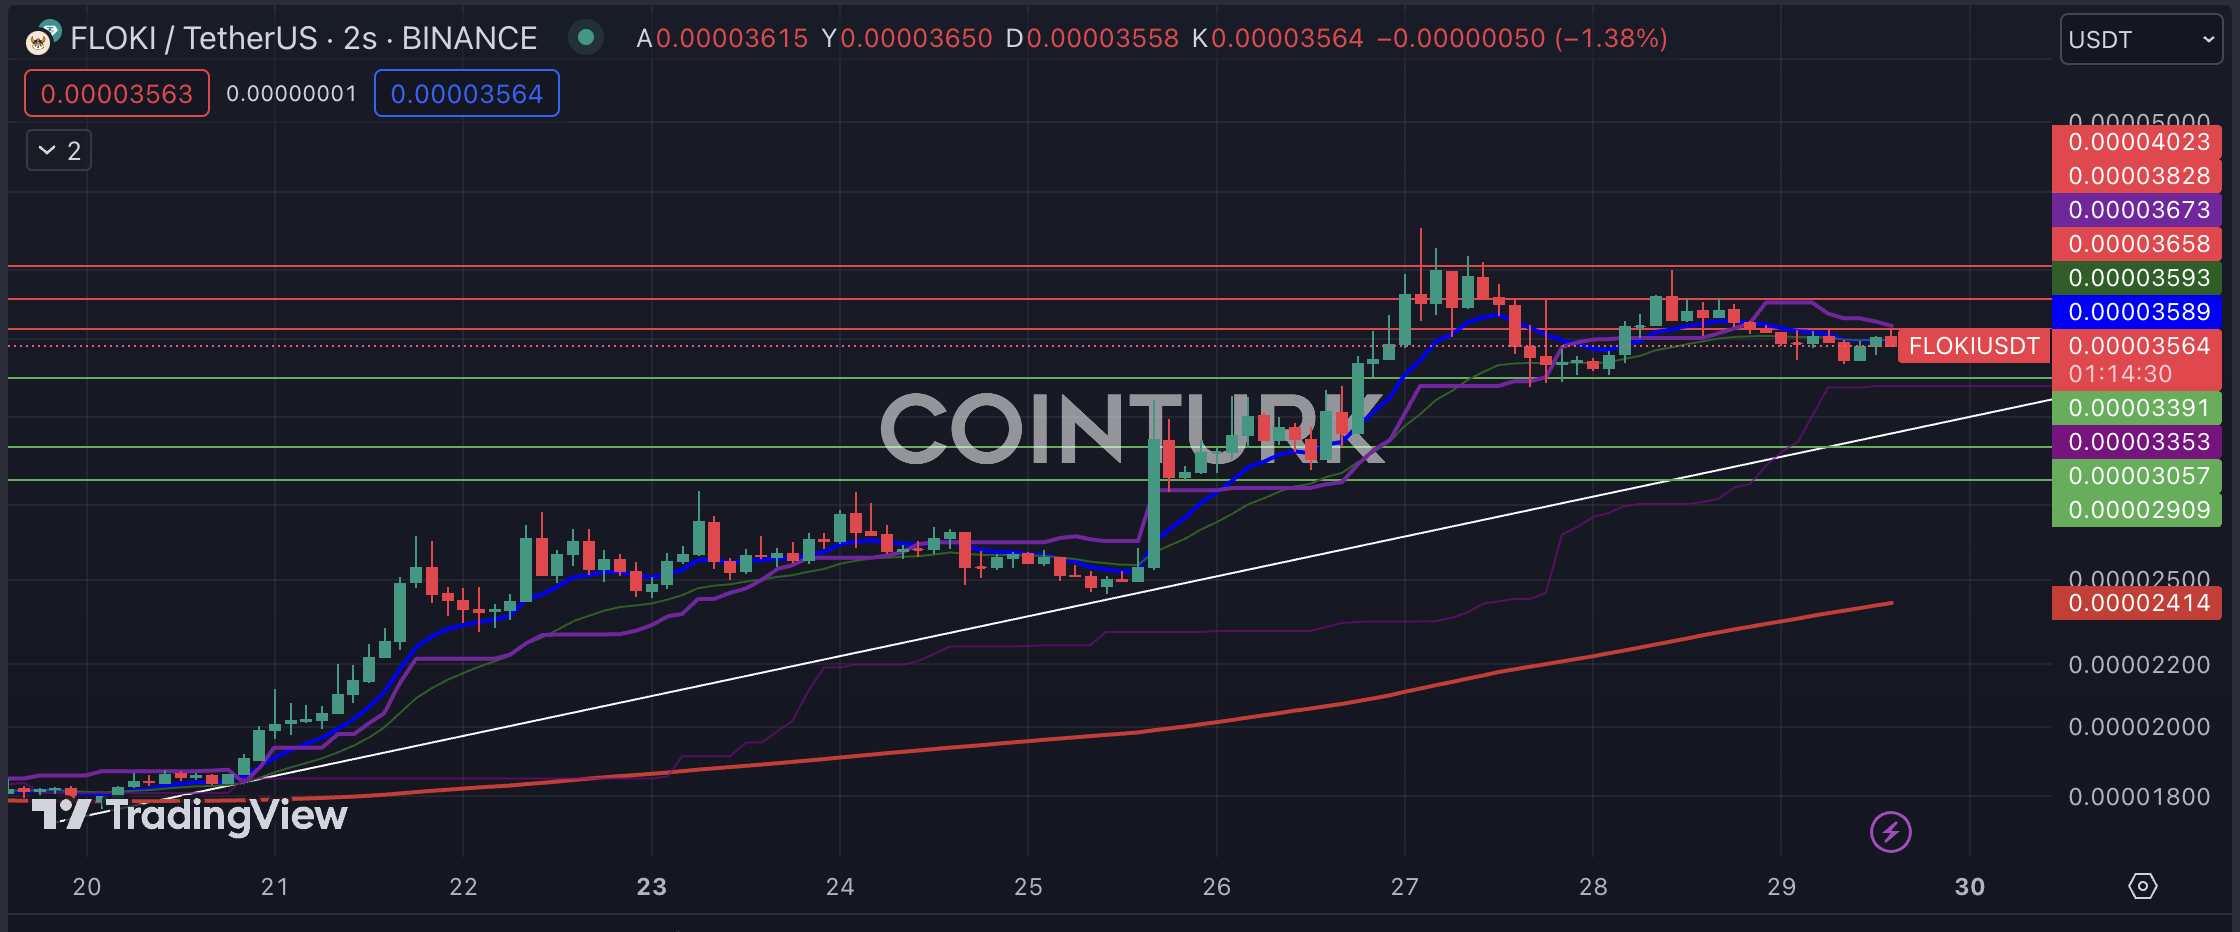
The meme token that caught everyone’s attention with its rise this week is FLOKI. FLOKI, which incentivizes its investors for stake protocols through agreements made by the team, has gained significant upward momentum with this strategy. On the two-hour chart, there have only been two touches to the support line that is considered. The positive news flow has increased volatility along with the rapid rise in price.
The support levels that should be followed for FLOKI are respectively; $0.00003391, $0.00003057, and $0.00002909. Especially if the bar closes below the $0.00003057 level, it may cause a break in the support line. The resistance levels to be noted for FLOKI are respectively; $0.00003658, $0.00003828, and $0.00004023.

 Türkçe
 Español

