The recent surge in the market, led by Bitcoin, has enabled investors in the cryptocurrency market to make significant profits. As of the time of writing, Bitcoin is trading at $37,634, reaching its highest level since May 2022. The king of altcoins, Ethereum, has also joined this race by breaking the $2000 resistance level. So, will the Ethereum price reach $5000? Let’s examine together.
Ethereum Daily Chart Analysis
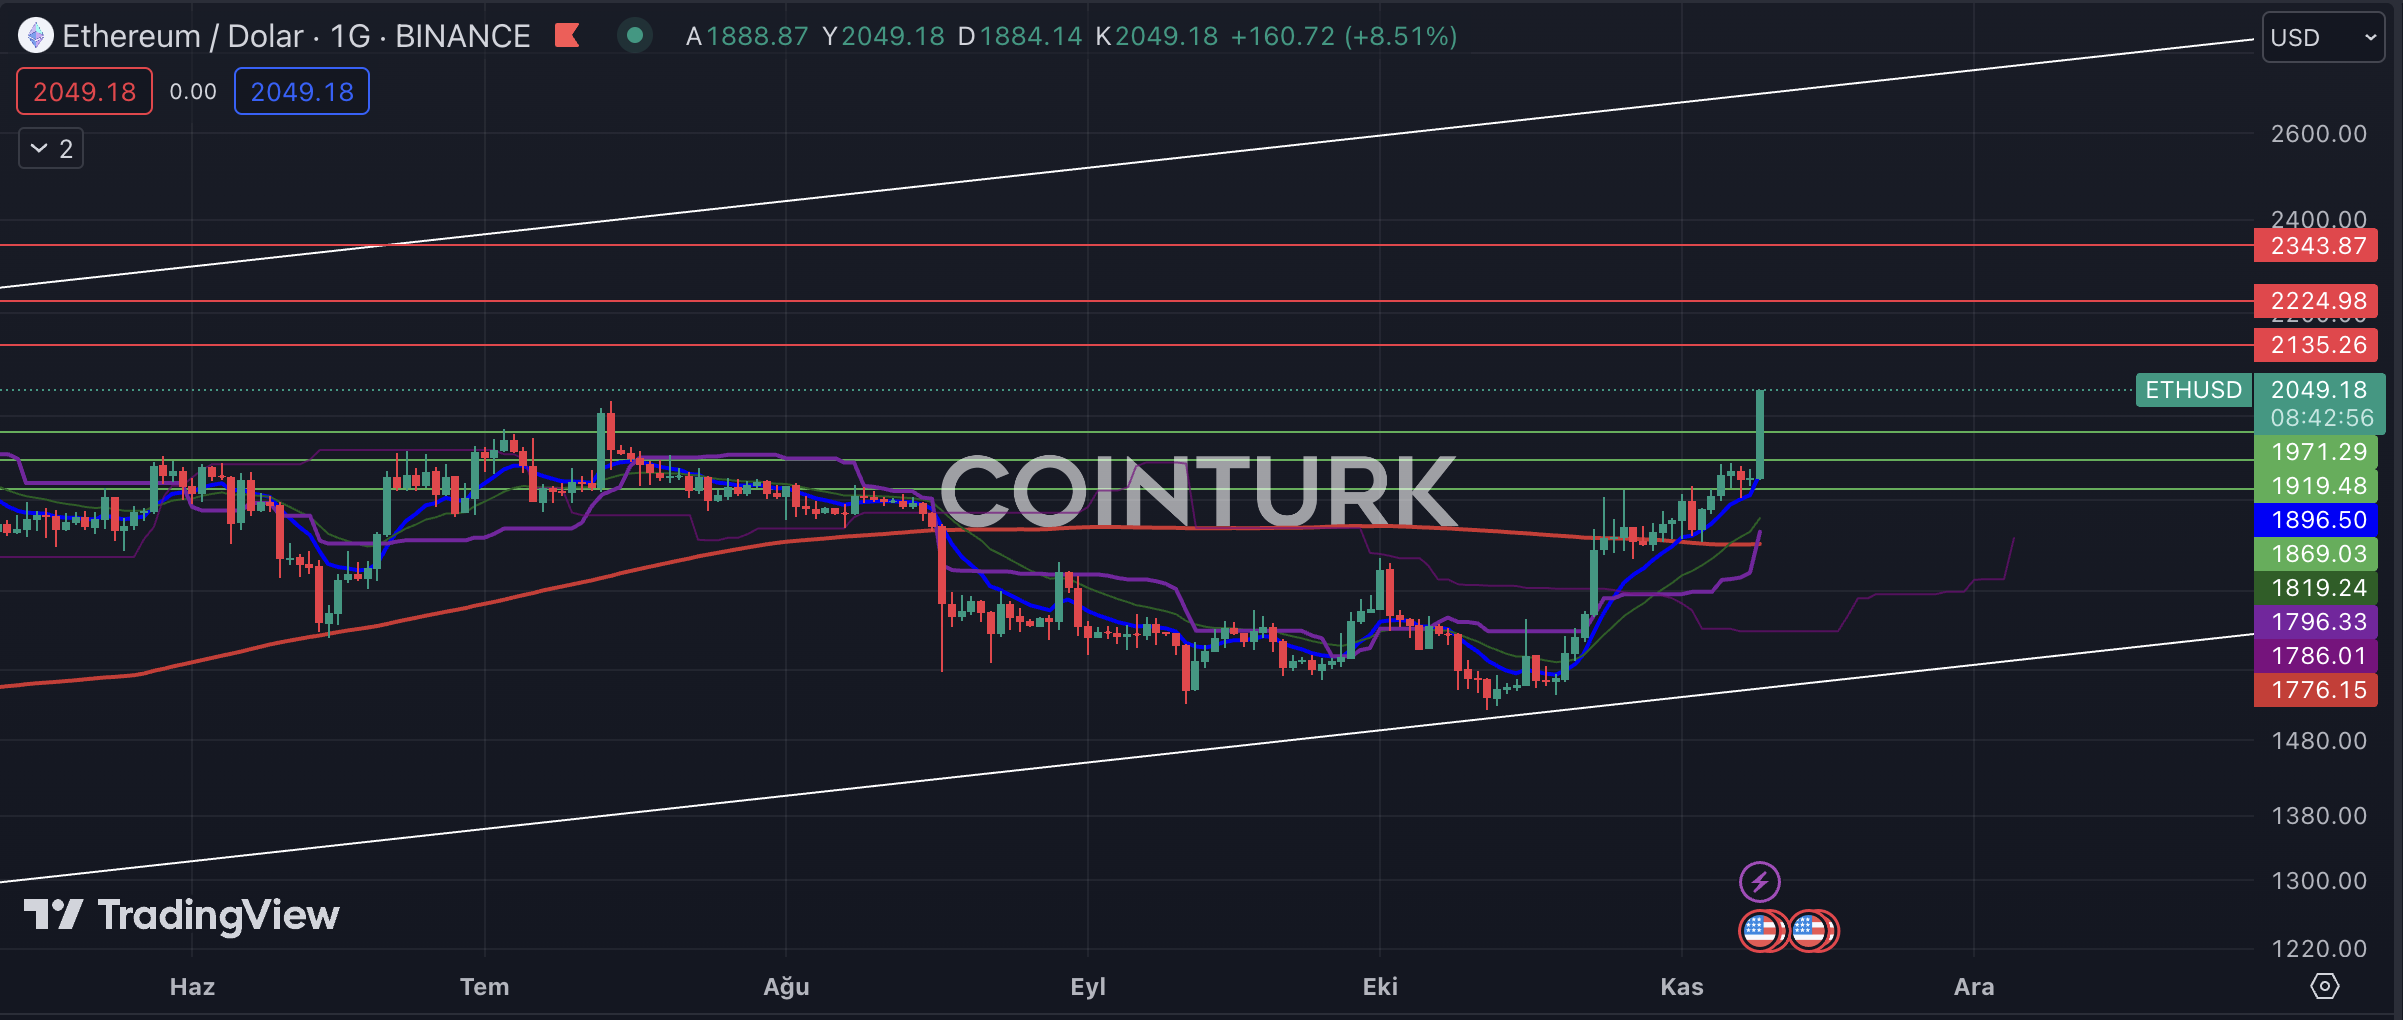
The ascending channel formation that has been forming since April 2023 continues to draw attention on the daily chart. Ethereum, which gained strength from the support zone in the second week of October, has accelerated its upward momentum with the break of the EMA 200 average. Ethereum has reached its highest level since July, with the NFT market also gaining momentum.
The support levels to be followed on the daily chart for Ethereum are respectively $1971, $1919, and $1869. Especially, if the daily bar closes below the $1971 level, which forms the basis of the recent surge, the momentum for ETH may decrease, and the formation support line may come back into play.
The resistance levels to be noted on the daily chart for Ethereum are respectively $2135, $2224, and $2343. Especially, if the excitement in the markets continues, a breakout may occur in the ascending channel formation with the break of the $2343 level, which can contribute to the breaking of a new record level.

Ethereum Weekly Chart Analysis
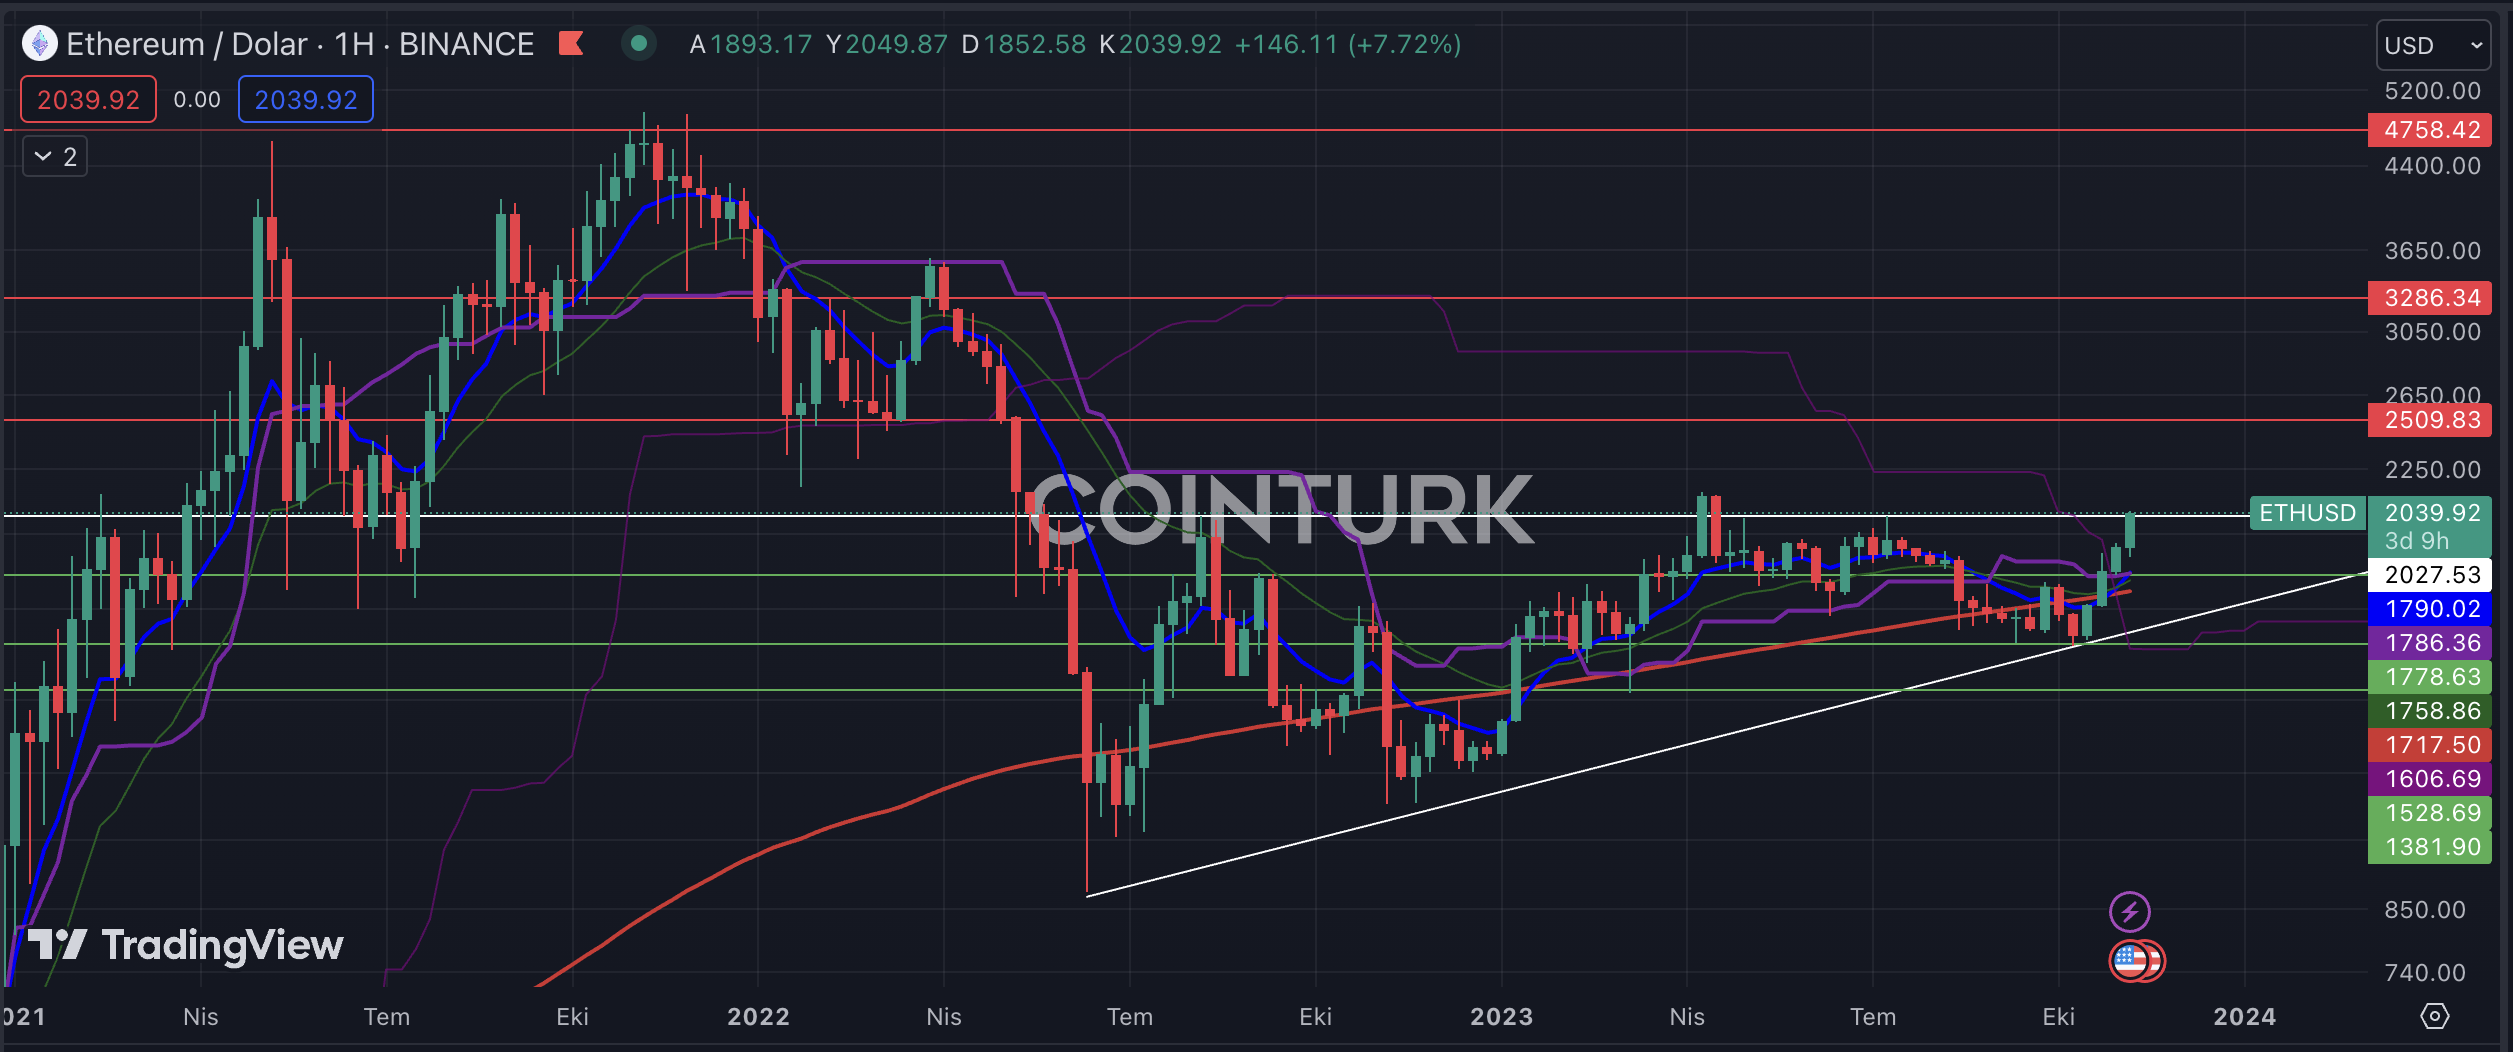
The first notable formation on the weekly chart for Ethereum is the bearish triangle formation. Although this formation structure is known as a negative structure in traditional markets, the unwritten rules of the cryptocurrency markets can surprise us all. With today’s rise, a breakout occurred at the $2027 level, which has been acting as resistance since July, and a weekly close above this level will help accelerate the upward momentum.
The support levels to be followed for Ethereum on the weekly chart are respectively $1778, $1528, and $1381. Although these levels currently seem unlikely, a bar closure below the $2027 level can lead to a retest of these levels.
The resistance levels to be noted for Ethereum on the weekly chart are respectively $2509, $3286, and $4758. Especially, the breakout of the weekly EMA 200 average and the upward movement of the formation can lead to the $4758 level being reached in the near future.


 Türkçe
 Español


