Technical analysis is an essential indicator for investors trading in the futures market in the cryptocurrency market. But what clues does technical analysis provide for Bitcoin, which is currently trading at $39,729? We examine it with a detailed chart analysis and important support and resistance levels.
Bitcoin Four-Hour Chart Analysis
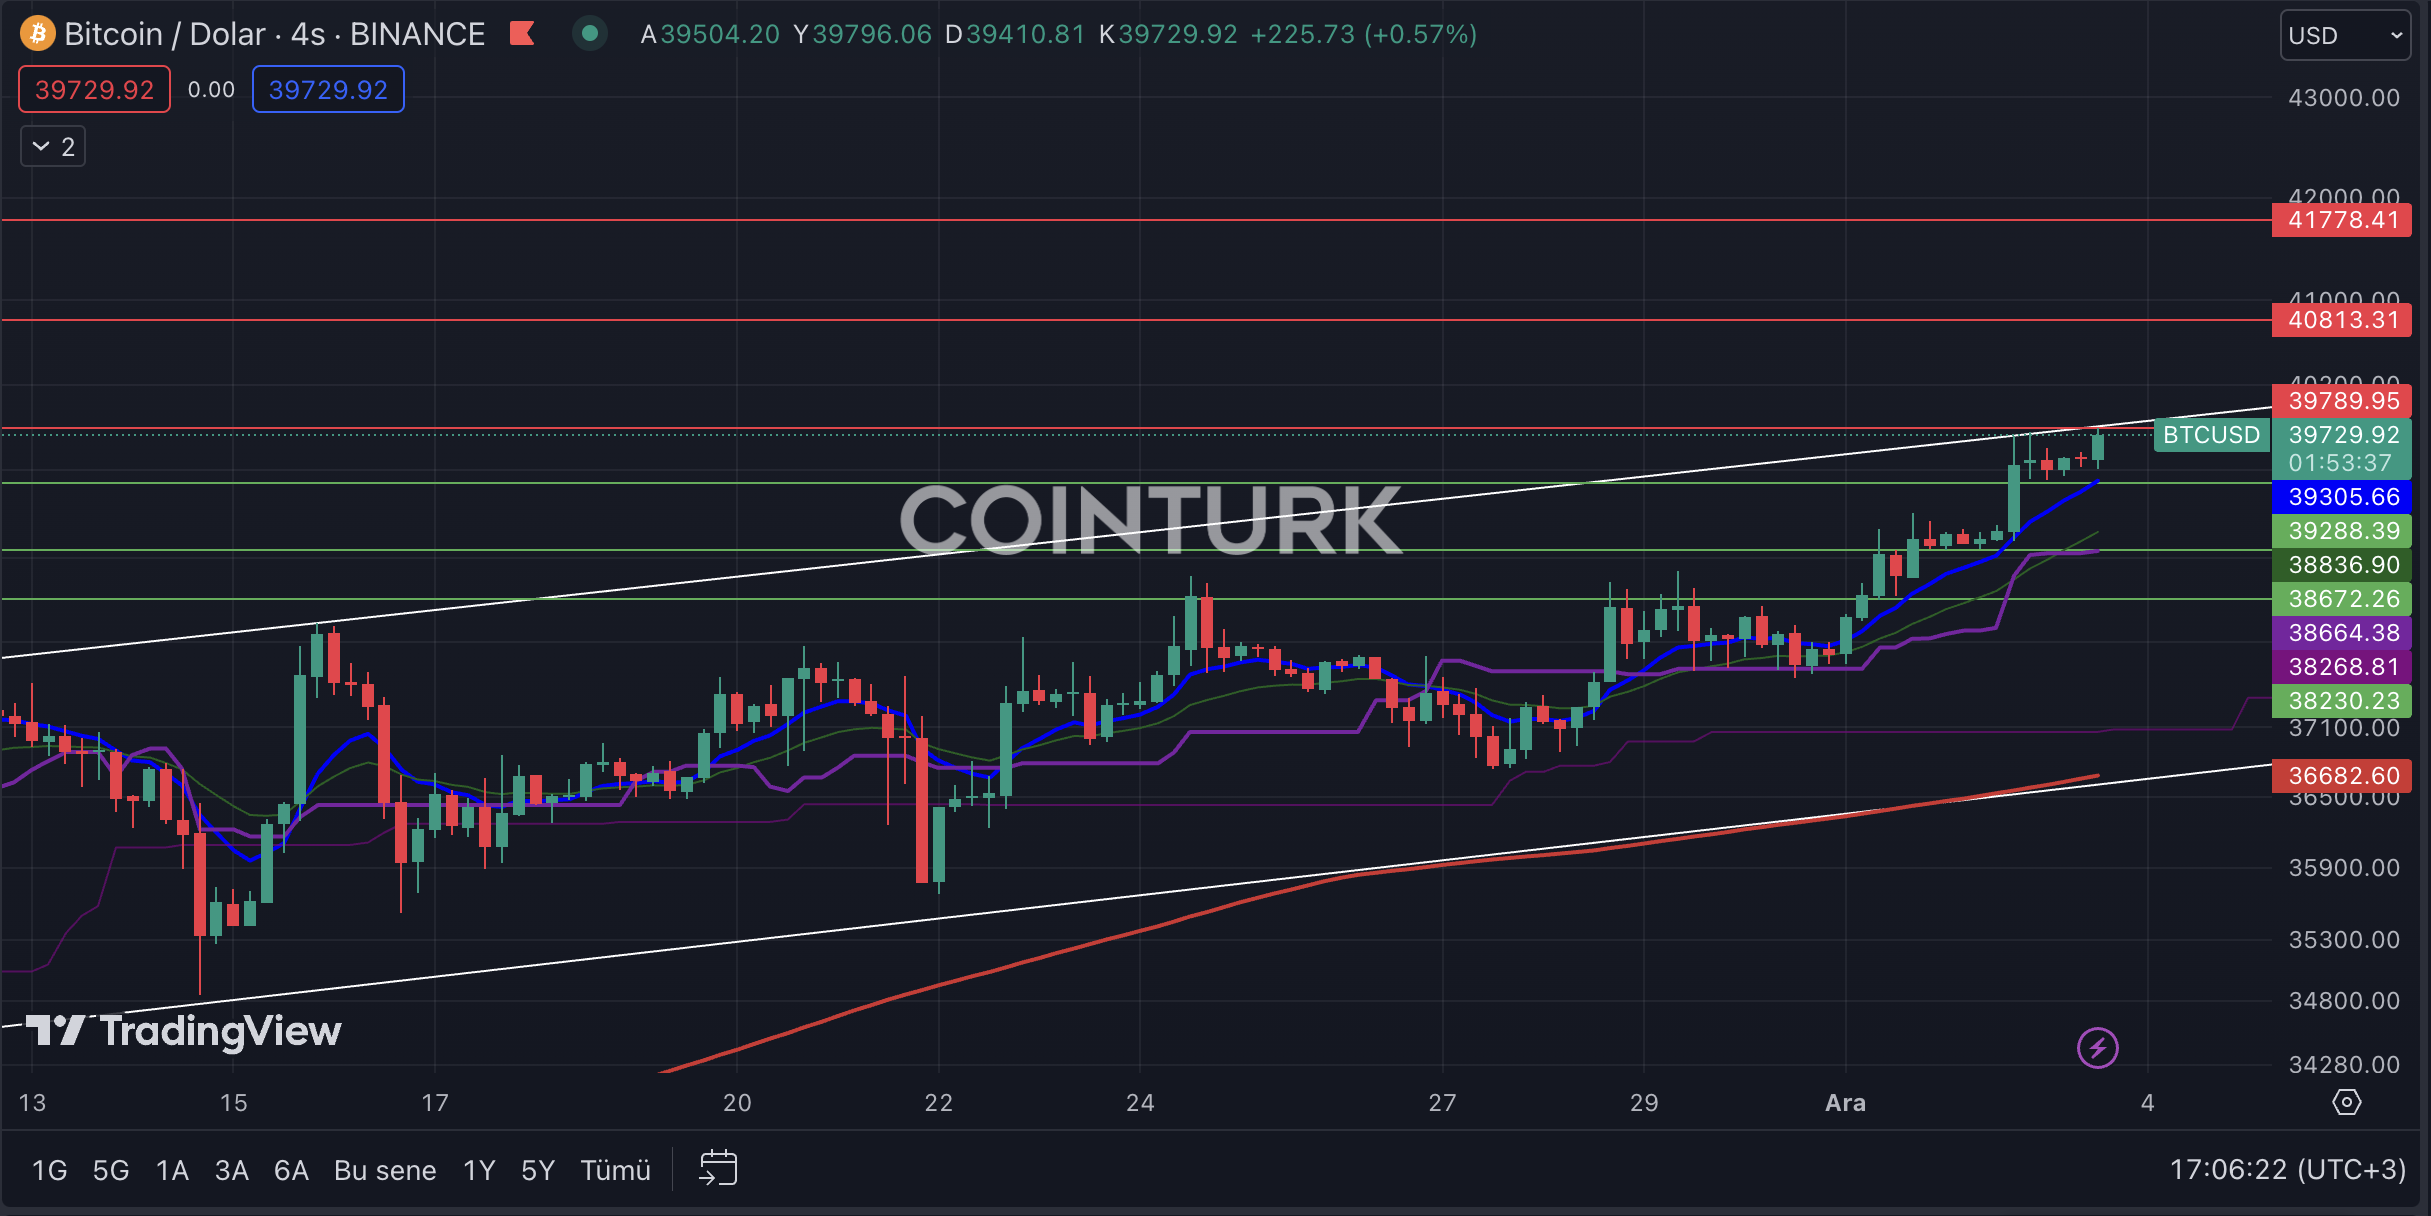
The ascending channel formation stands out on Bitcoin’s four-hour chart. The fact that there has been no support or resistance breakout in this structure provides important clues, especially for short-term investors. The upcoming support or resistance breakout will determine the direction for Bitcoin, which is currently consolidating in a narrow range.
The most important support levels to be monitored on Bitcoin’s four-hour chart are respectively $39,288, $38,672, and $38,230. If the four-hour bar closes below the intersecting level with EMA 7 (blue line) at $39,288, it will lead to selling pressure in the short term.
The most important resistance levels to be considered on Bitcoin’s four-hour chart are respectively $39,789, $40,813, and $41,778. A breakout above the intersecting level with the ascending channel formation at $39,789 will enable Bitcoin’s price to gain momentum.

Bitcoin Chart Analysis
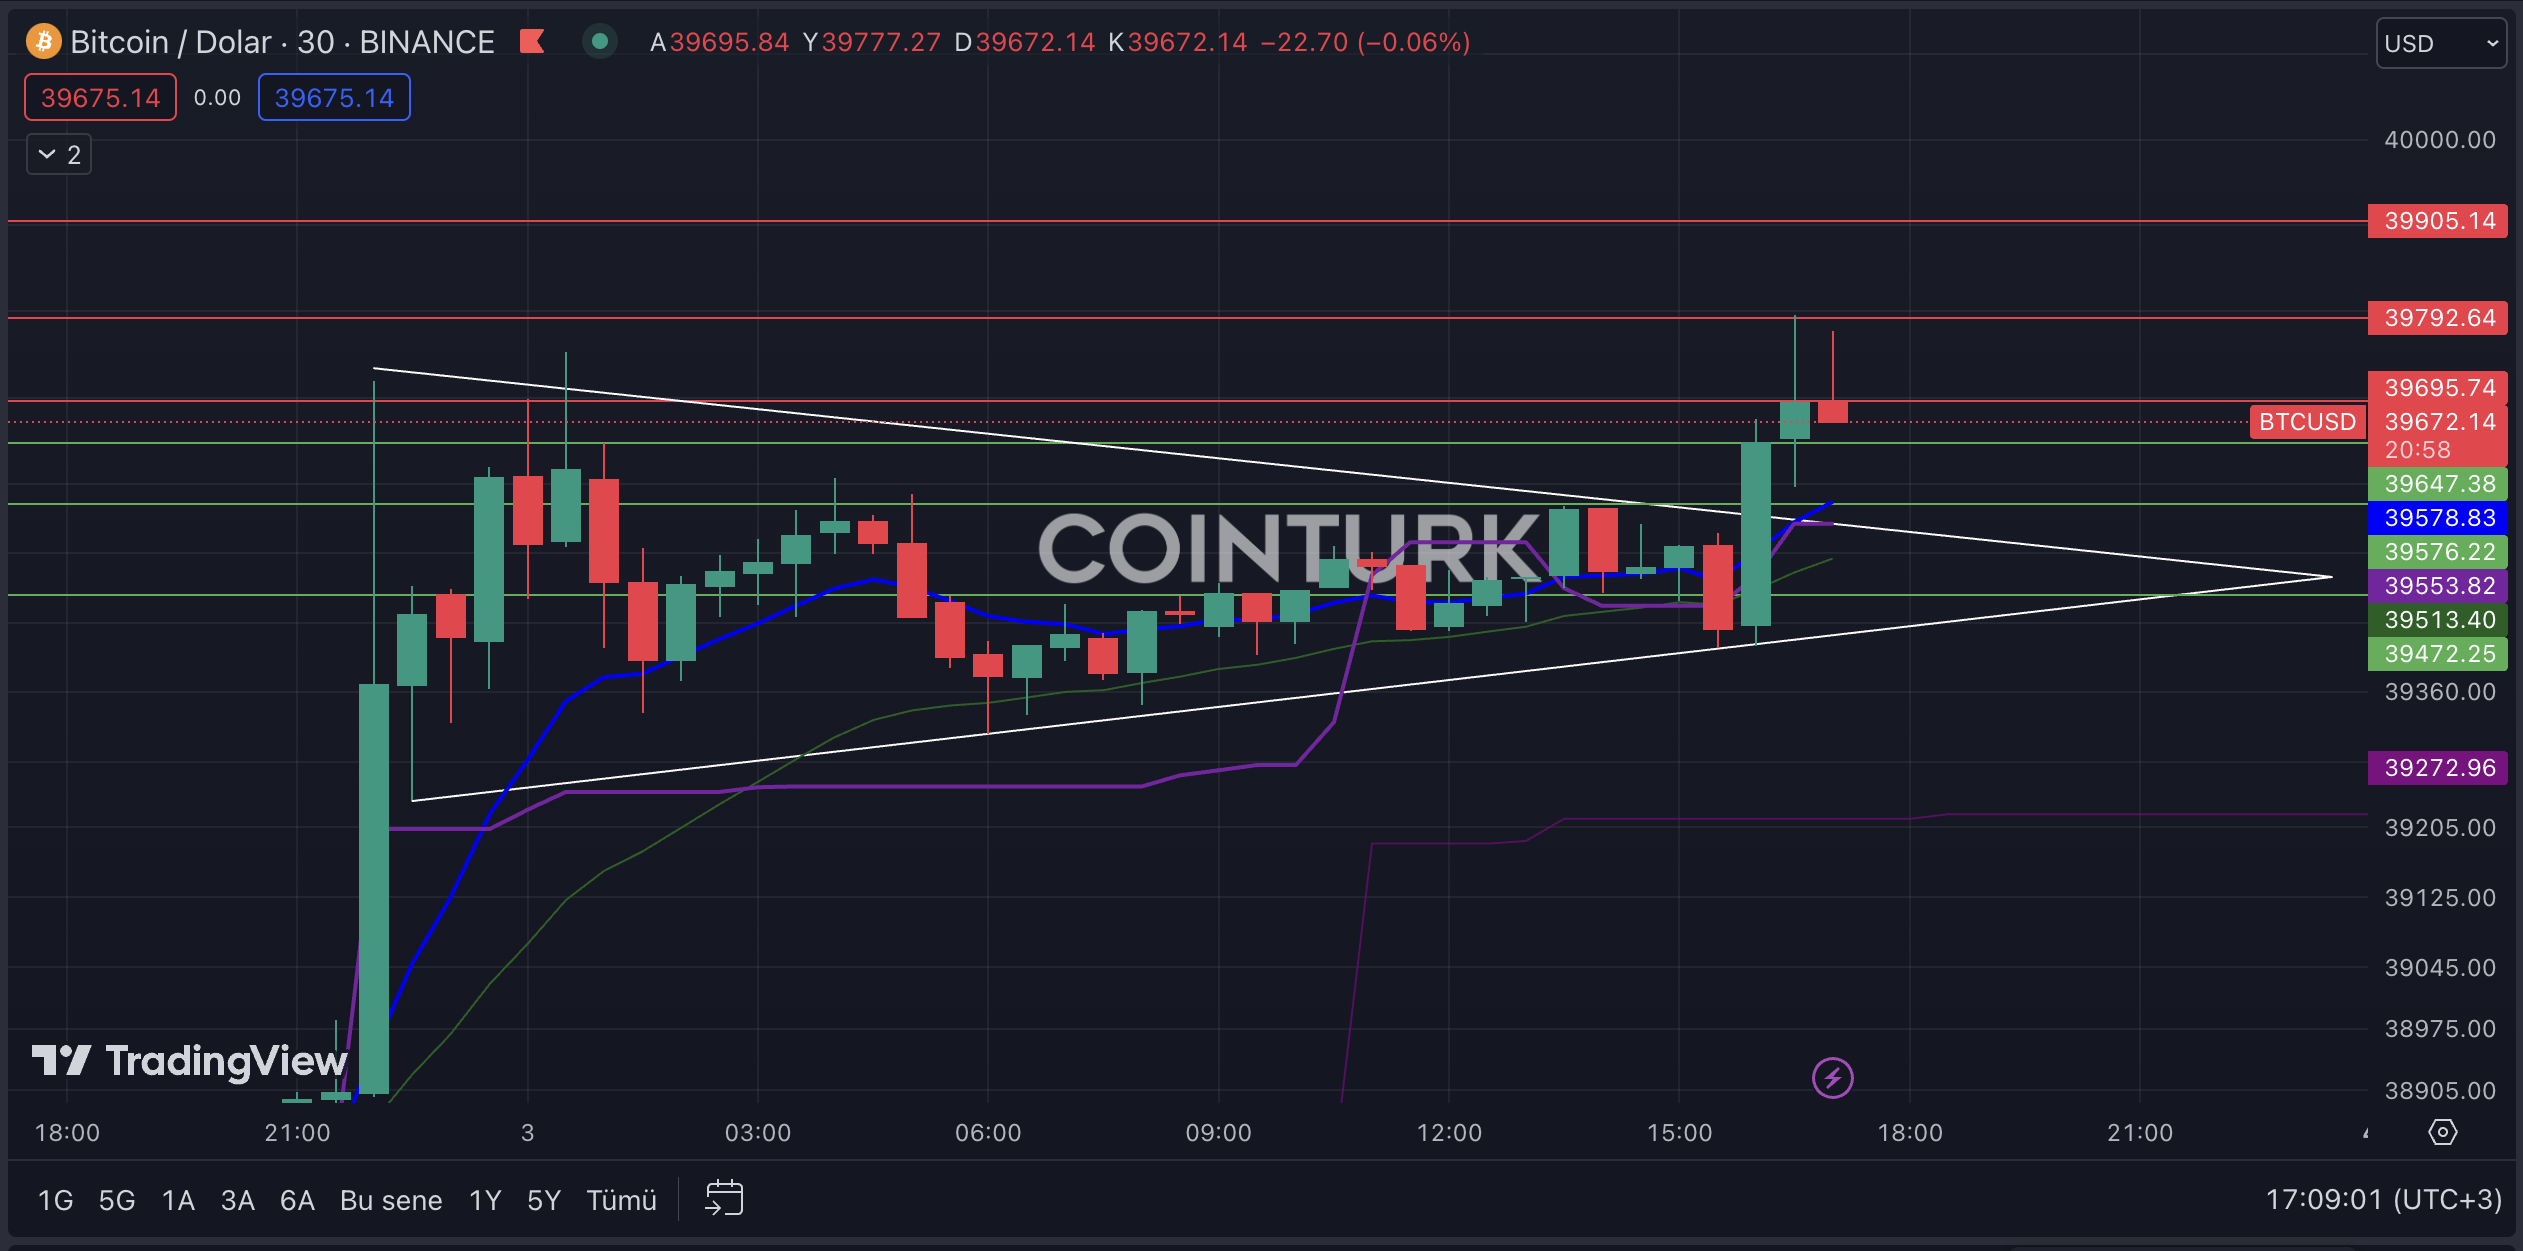
The ascending triangle formation stands out on Bitcoin’s 30-minute chart analysis. This structure attracts the attention of many investors after an upward movement. A breakout of the triangle formation’s resistance will lead to upward momentum in Bitcoin’s price in the short term.
The most important support levels to be monitored on Bitcoin’s 30-minute chart are respectively $39,647, $39,576, and $39,472. A close below $39,472 may disrupt the formation structure.
The most important resistance levels to be monitored on Bitcoin’s 30-minute chart are respectively $39,695, $39,792, and $39,905. A close above the significant barrier at $39,792 will allow Bitcoin’s price to gain momentum in the short term.


 Türkçe
 Español


