Chainlink (LINK) has been trading within a certain range over the last ten weeks. Last week, LINK rose by 20% from the $13.8 level to retest the $16.6 range.
LINK’s Analytical Reports
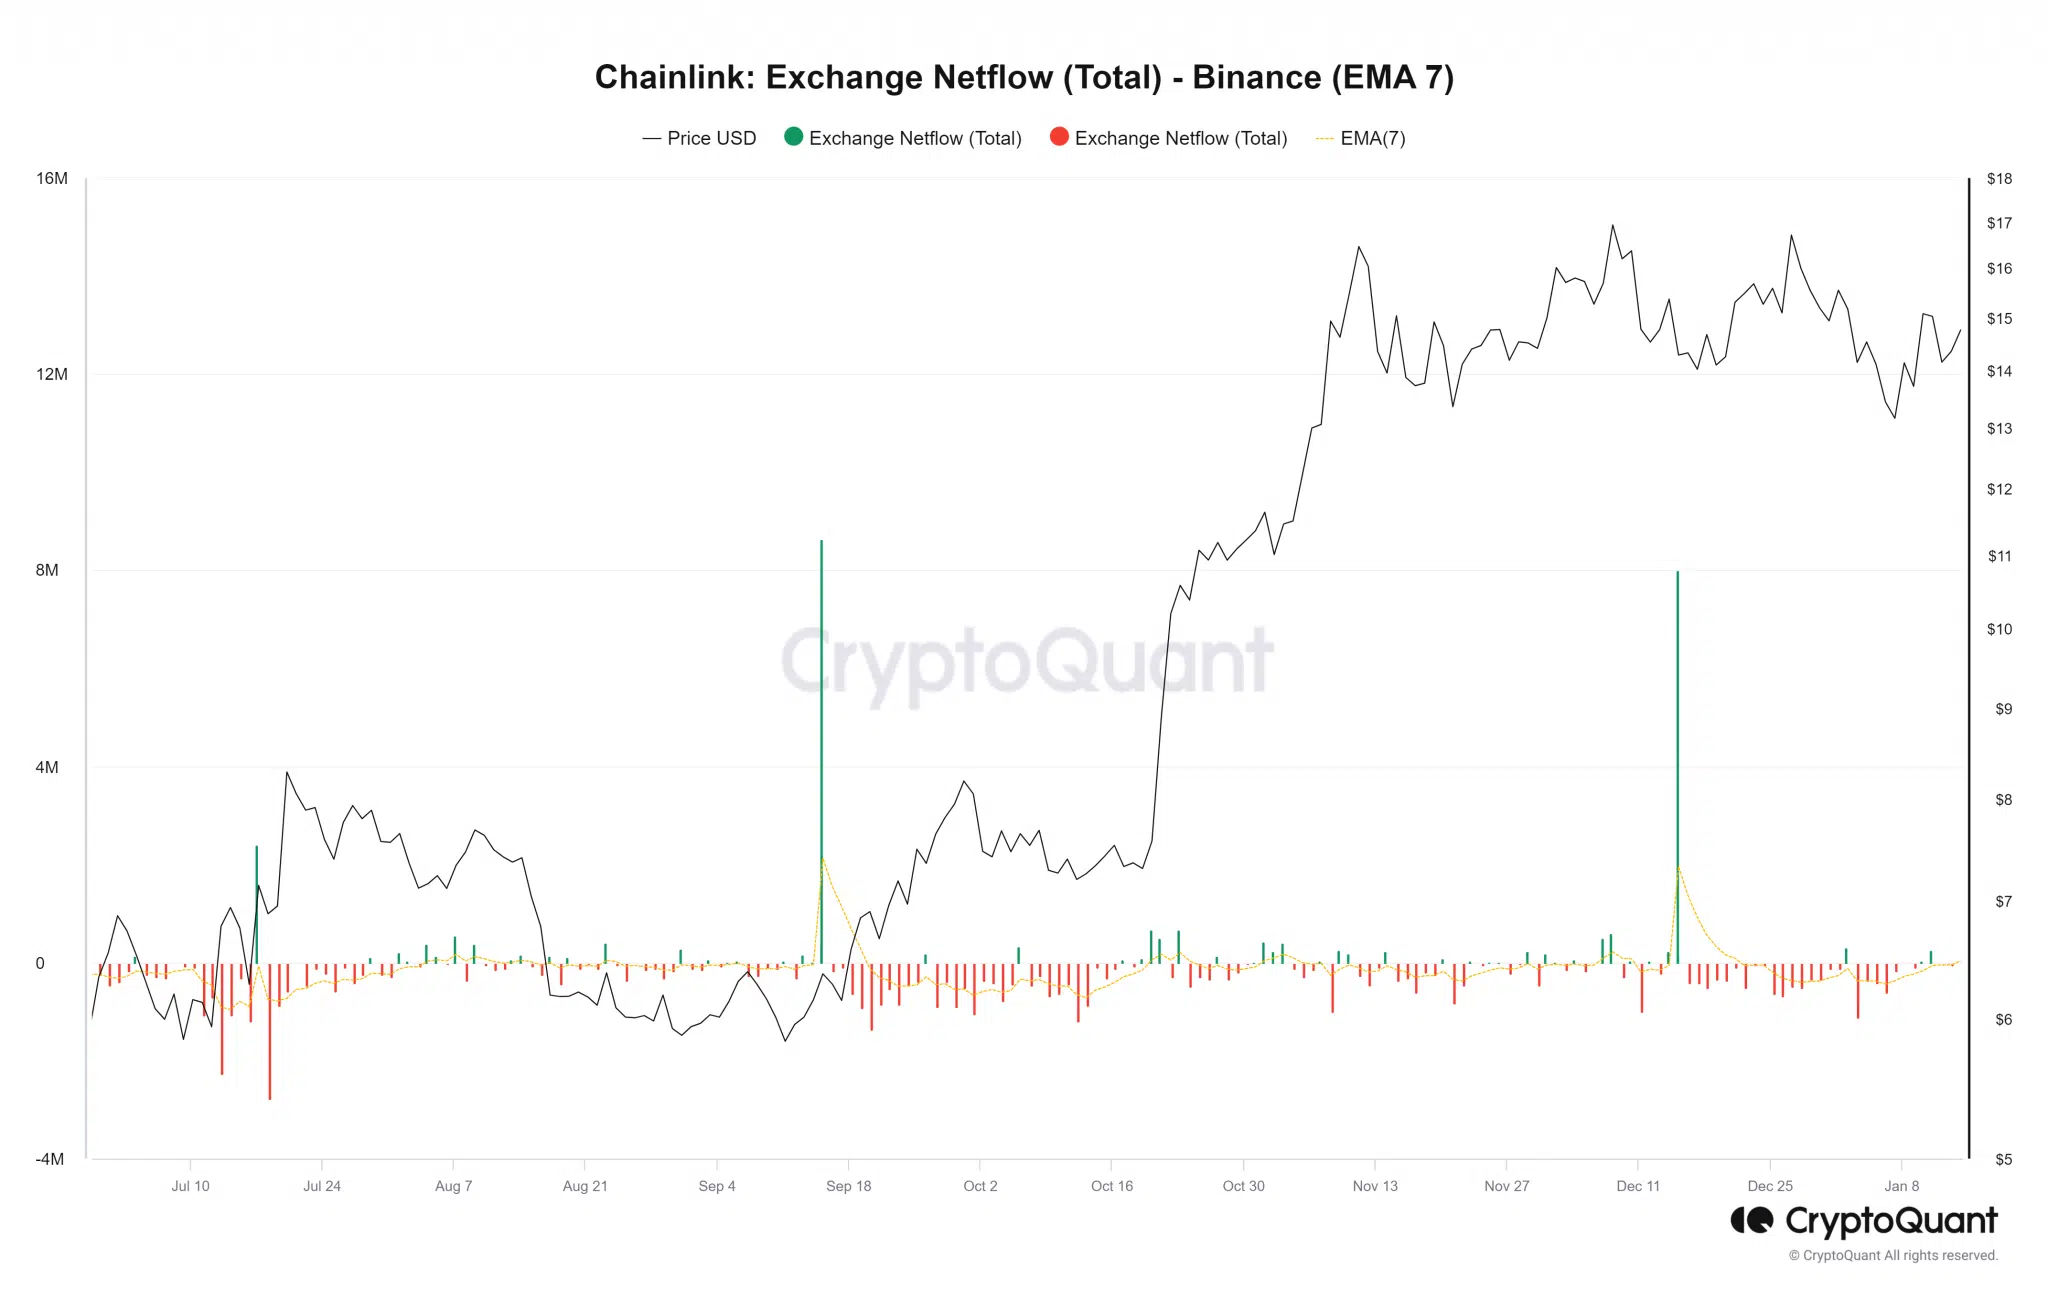
Bulls failed to break out on their third attempt in six weeks. However, underlying on-chain metrics indicated accumulation. A recent report suggested that a move towards $20 was likely. These observations continued to support this claim. According to data from the crypto analytics firm CryptoQuant, net flow is the difference between the money entering and leaving an exchange. A higher inflow can often be a sign of selling pressure.
The 7-day EMA of net flow showed that the metric had been on a downward trend from December 16 to January 9. This steady outflow could be a sign that buyers were withdrawing LINK from exchanges at the time of writing. The company also analyzed Chainlink’s exchange supply ratio. This metric can be calculated by dividing the exchange reserve by the total supply. When this measurement decreases, it indicates that the supply in exchange wallets is decreasing compared to the total supply. These charts were strong evidence that LINK tokens were increasingly being withdrawn from exchanges at the time of writing. On the other hand, network activity decreased slightly in January.

Current Data on LINK
LINK’s development activity rebounded strongly after the end of the festival season. This could be a positive development for long-term investors that institutional investors can trust. The measurements have been positive so far, but network growth saw a slight decline in January. Since December 29, the metric for daily active addresses also formed a series of lower peaks.
Network growth also showed a decline in January. Both measurements only saw a slight decrease, but this could be a sign of potential declining momentum. This situation could indicate that the user base has shrunk in the last three weeks, which was a bearish finding. This could result in Chainlink prices remaining in a range for a longer period.

 Türkçe
 Español


