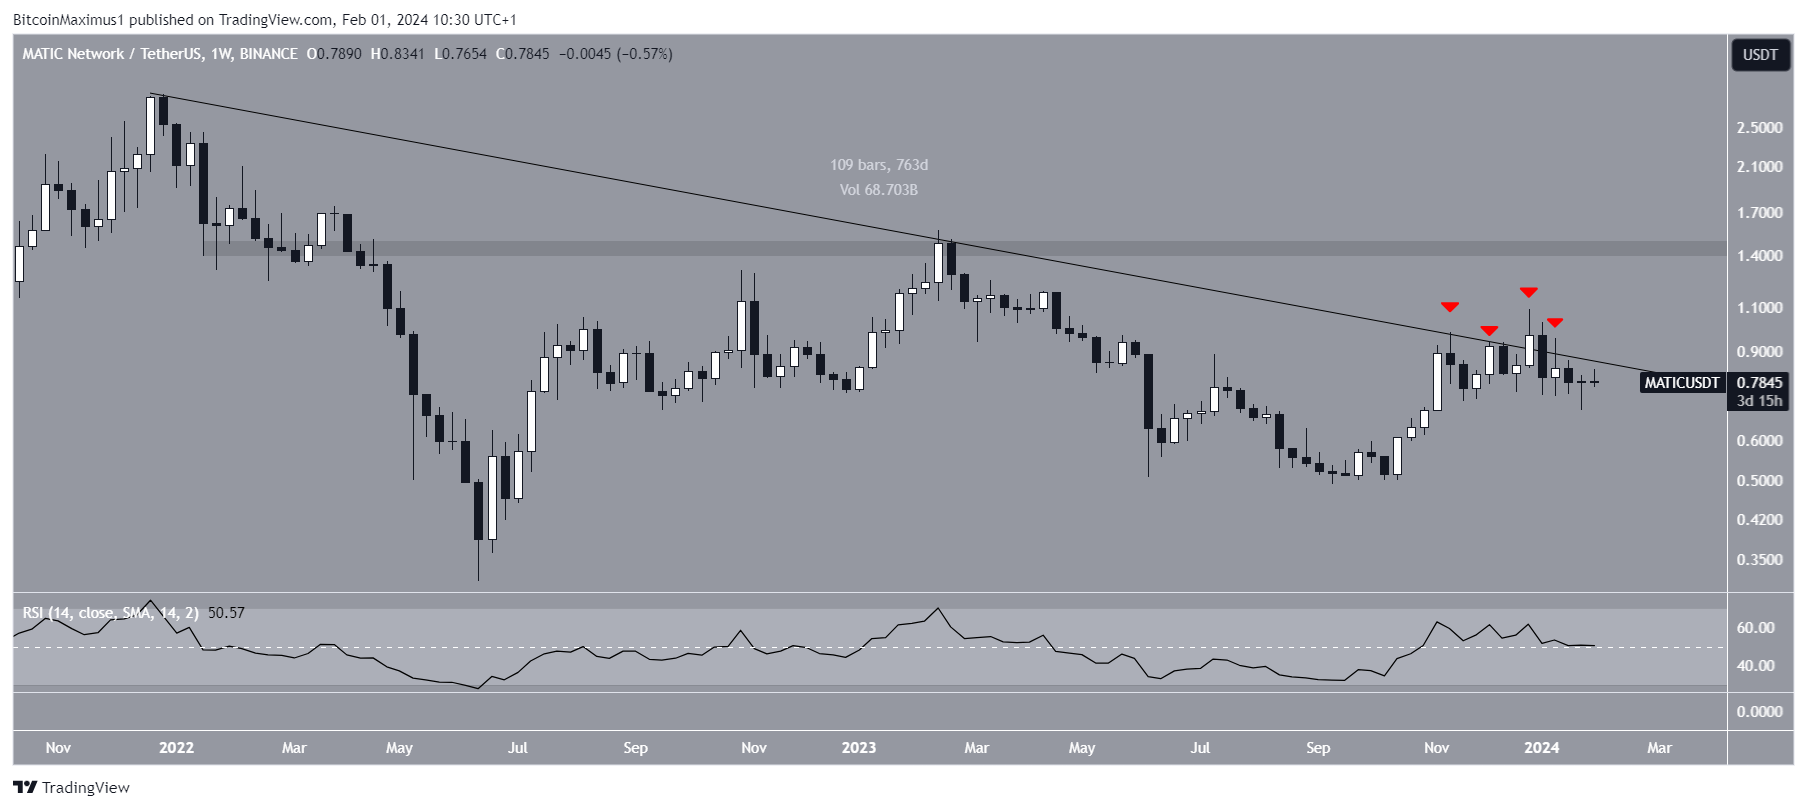
Polygon (MATIC) price has fallen below a long-term resistance trend line since reaching its all-time high in December 2021. Additionally, MATIC is following a short-term resistance trend line.
MATIC’s Resistance Line
Technical analysis of weekly charts by cryptocurrency analysts indicates that the MATIC price has fallen below a declining resistance trend line since reaching its all-time high in December 2021. The downward movement peaked with a low of $0.32 in June 2022. Since then, the MATIC price has increased but still trades below the declining resistance trend line.
Since November 2023, the altcoin’s price has made four unsuccessful breakout attempts before retreating. The weekly Relative Strength Index (RSI) shows a downtrend. Investors use the RSI as a momentum indicator to assess market conditions, determining whether the market is overbought or oversold and whether a token should be accumulated or sold. If the RSI value is above 50 and the trend is upward, the bulls still have the advantage, but if the reading is below 50, the opposite is true.

Current Data on Altcoin
The indicator is falling but still above 50, which could be a sign of an uncertain trend. Similarly to the weekly timeframe, the daily timeframe also shows a downtrend due to price movement and RSI. This could indicate that MATIC has been falling below a declining resistance trend line since the beginning of the year.
More recently, the trend line rejected MATIC yesterday, creating a bearish candlestick. This is consistent with the RSI rejection coming from 50. Cryptocurrency analyst Crypto Rover highlighted the importance of the trend line but suggested that the price will eventually rise. MATIC is trading below the descending resistance line but above the $0.72 horizontal support area, and if broken, it could fall 20% to the nearest support at $0.60.

 Türkçe
 Español


