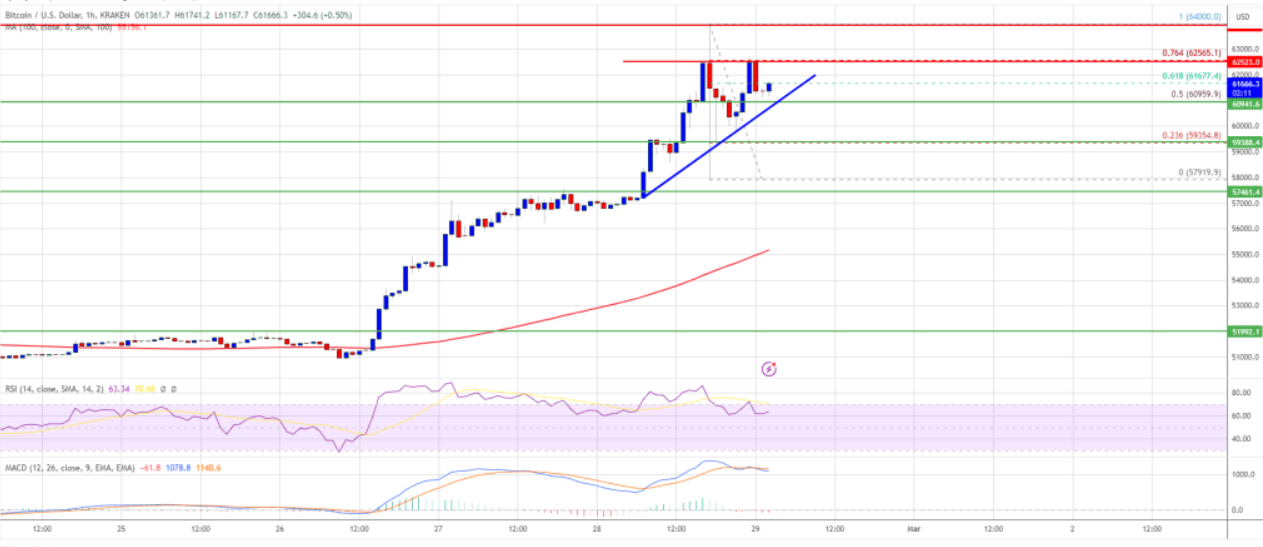
Bitcoin price experienced a whirlwind last evening, rapidly falling from the $64,000 level to $58,700. BTC is currently trading above $61,000. These swift movements are generating excitement within the cryptocurrency community, and the quick recovery indicates a possible rise back towards the $64,000 resistance level soon.
Bitcoin Price Solidifies Its Position
Lately, Bitcoin price was consolidating gains below the $60,000 resistance area. However, it is now trading around $61,250 and above the 100-hour Simple Moving Average. Additionally, there is an ascending trend line forming with support near $60,950 on the hourly chart of the BTC/USD pair. These indicators suggest that the price may soon extend towards the $64,000 resistance zone.
Bitcoin has shown significant performance recently. Staying strong above the $58,000 resistance area, the cryptocurrency BTC has established a new support base and initiated another rally. This rally enabled the price to overcome several hurdles around the $60,000 and $62,000 levels.

However, while ascending towards the $64,000 level, a sharp decline occurred following a Coinbase outage, and the price retreated to the $58,000 support zone. Despite this drop, the price has started an upward movement again, breaking above the $61,000 resistance.
What Could Happen to BTC in the Coming Days
Bitcoin is currently trading above $61,000 and the 100-hour Simple Moving Average. There is also an ascending trend line with support near $60,950 on the hourly chart of the BTC/USD pair. Immediate resistance is near the $62,500 level. However, the price’s downward move from the $64,000 level to $58,700 should be considered, especially as it is near the 76.4% Fib retracement level.
In the coming days, the critical resistance level for the cryptocurrency Bitcoin could be $64,000, and above this, the price may rise towards the $65,000 resistance zone. However, if declines are supported, the price could fall below the $62,500 resistance area and retreat towards the $60,000 level.
Technical indicators show that the hourly MACD is gaining momentum in the bullish zone and the hourly RSI for BTC/USD is above the 50 level. Key support levels are set at $60,800 and $60,000, while resistance levels are identified at $62,500, $64,000, and $65,000.

 Türkçe
 Español


