Cryptocurrency world’s shining stars among memecoins, Pepe (PEPE) and Shiba Inu (SHIB), have recently attracted attention with their significant price movements. Investors are curious about what’s next for PEPE and SHIB as they have been trending downward for some time.
Pepe Price Analysis
PEPE has seen an impressive increase of over 700% against the US dollar in the last four weeks, reaching a significant resistance range between $0.0000087 and $0.0000117. The rising trend followed by a double top formation and the falling divergence in the Relative Strength Index (RSI) suggest that the memecoin may be on the verge of a potential medium-term correction.
If PEPE’s price falls below the support level of approximately $0.0000061, analysts foresee a downward trend towards the next liquidity level around $0.0000049. However, if PEPE bulls manage to consistently push the price above the recent high, a reversal of the short-term downtrend and the start of an uptrend can be expected. Crypto Traders Are Rushing to This App – Here’s Why You Should Too
Shiba Inu Price Analysis
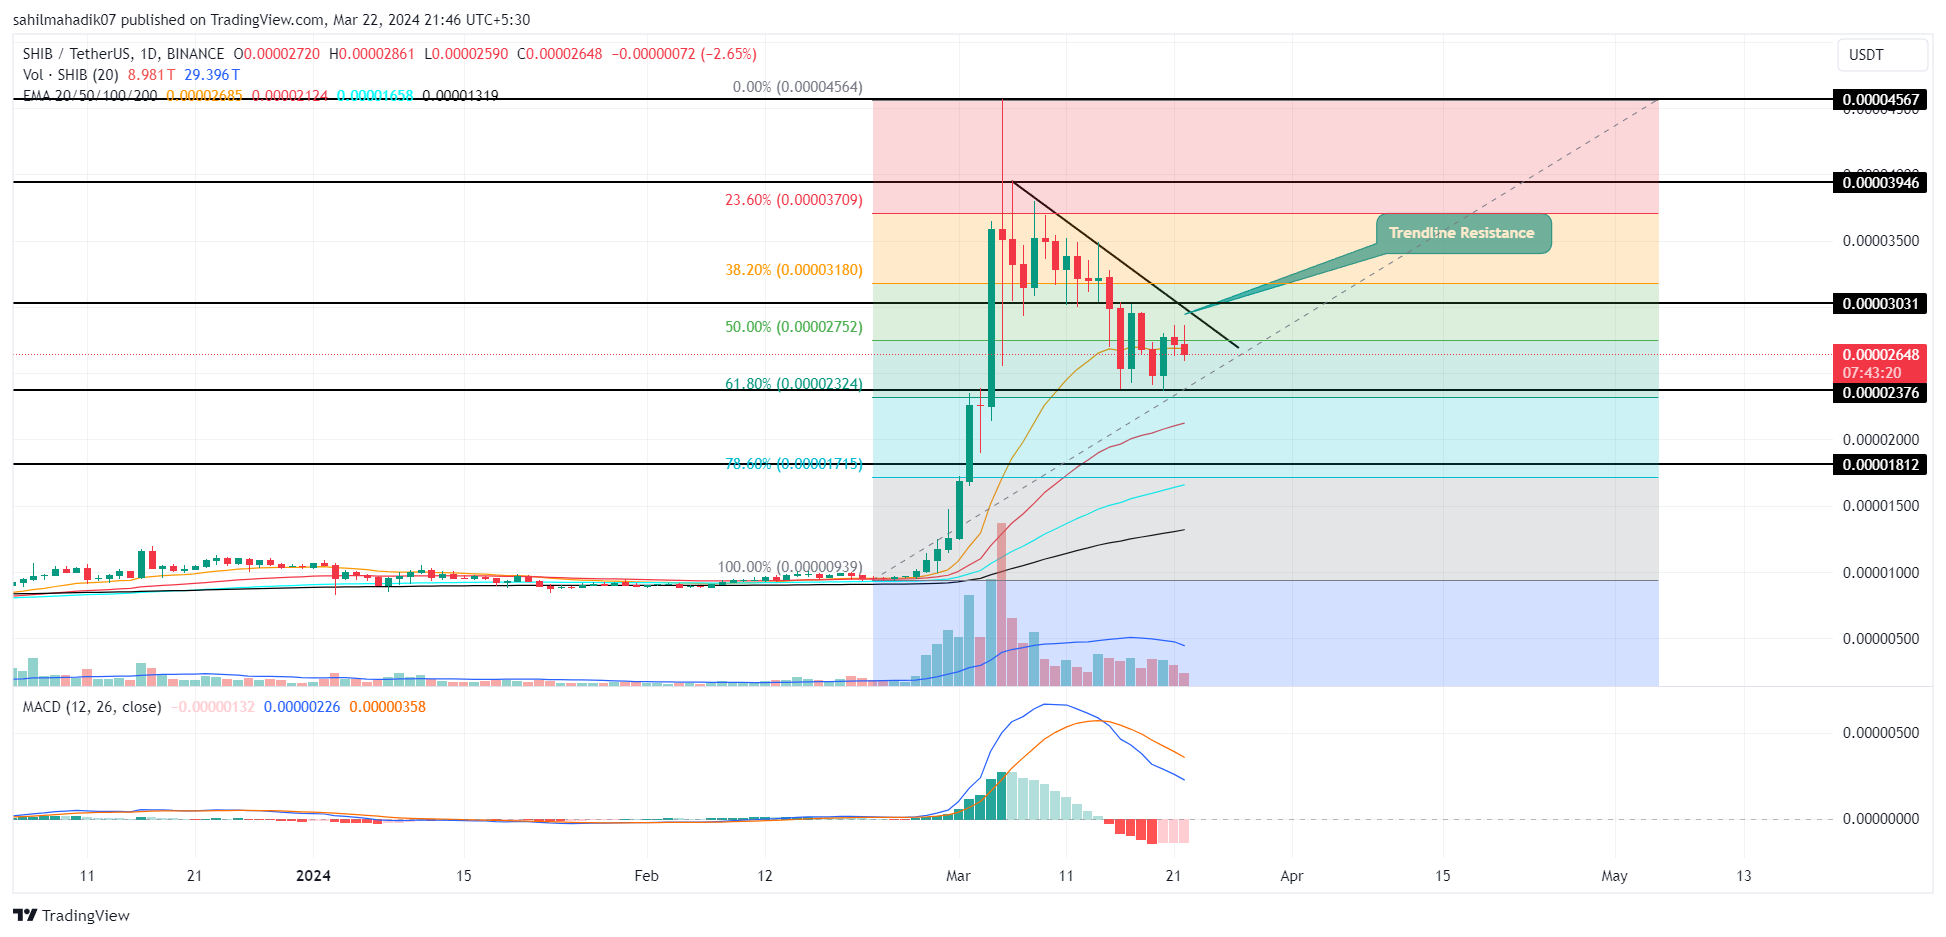
The second-largest memecoin, SHIB, has faced a correction trend over the past three weeks, experiencing a significant drop from $0.000045 to $0.0000259, losing about 45% of its value.

Daily chart analysis reveals a downward trend line acting as dynamic resistance for buyers and a break below the 50% Fibonacci retracement level, indicating weakened bullish momentum. Notably, recent data from the on-chain data platform IntoTheBlock shows significant inequality in investor behavior. Accordingly, there has been a substantial increase in SHIB holdings among short-term investors, while long-term holders have decreased their assets by 9.07%.
This shift in investor approach towards Shiba Inu points to increased speculative interest among newcomers or short-term investors, potentially increasing selling pressure and indicating that further support levels could be breached.
Looking ahead, if sellers manage to push the price below the 61.8% Fibonacci retracement level corresponding to $0.00002376, analysts predict a potential drop to $0.00001812 for SHIB’s price by the end of March. On the other hand, a recovery in SHIB could only occur if the price rises above the general trend line.
Technical indicators such as the rising 50-day Exponential Moving Average (EMA) could provide support at the $0.0000237 level, while a significant gap between the Moving Average Convergence Divergence (MACD) and the signal line indicates an intense correction trend for the memecoin.


 Türkçe
 Español


