The Bitcoin price has recently surged, approaching the $72,800 mark in the last 24 hours, as the anticipated major price correction prior to the Halving, which is about 11 days away, was avoided. This has fueled investor optimism for a continued uptrend. But what do the DXY and SP500 indicators suggest for cryptocurrencies?
S&P 500 Index Analysis
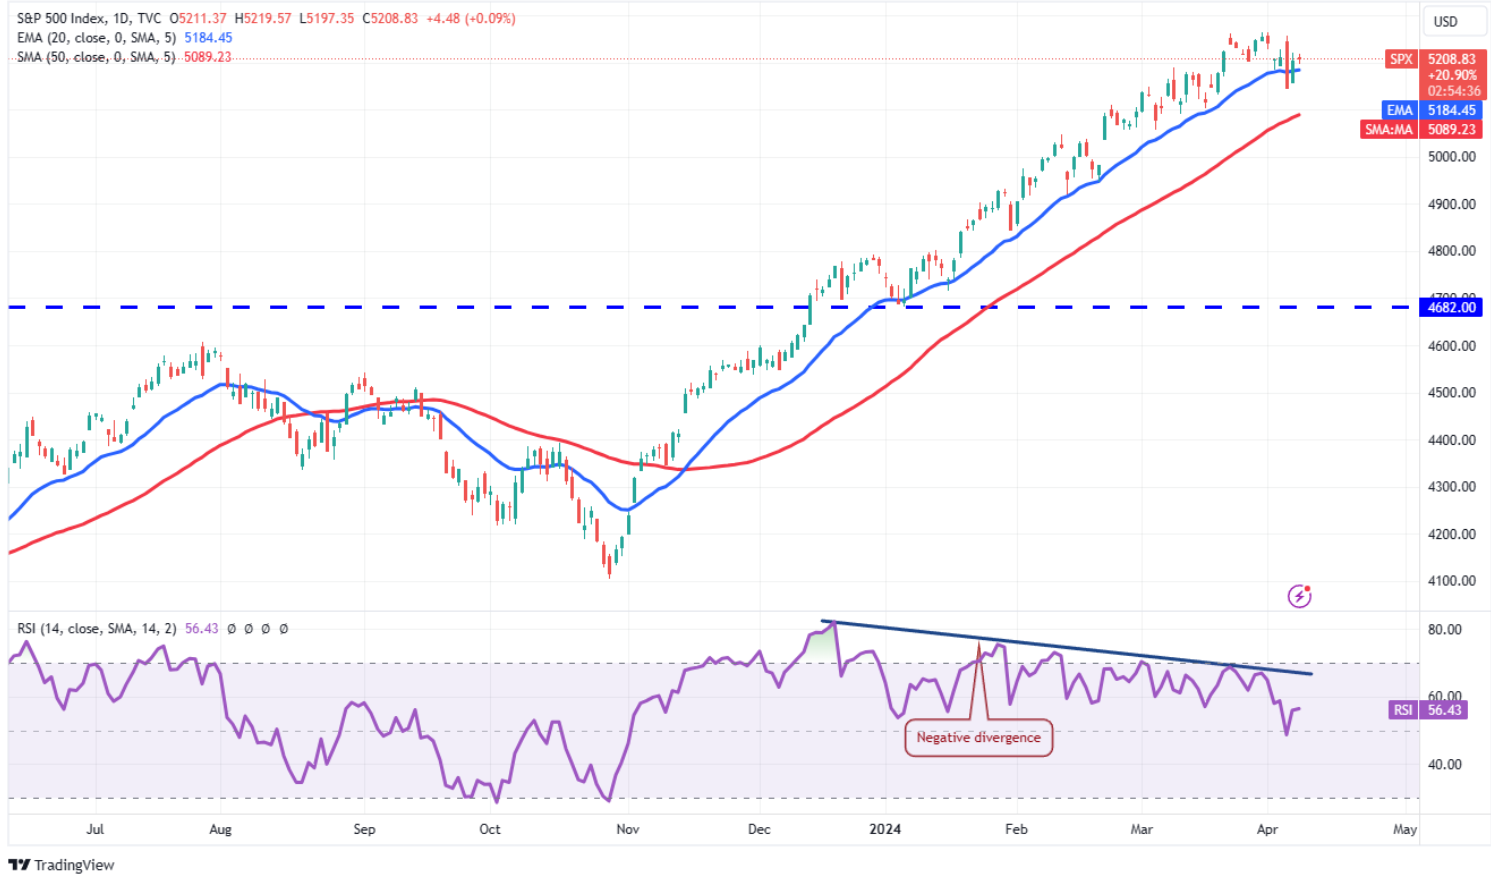
It’s well known that the US stock markets have a positive correlation with cryptocurrencies, and the SP500 data could provide insights into the next phase. The index did not give a directional signal on April 4 and 5. The 20-day exponential moving average (5,184) has flattened, and the RSI remains in the positive zone. The index is consolidating at higher levels.

A key level is 5,146, and closures below this could trigger a pullback to 5,089. Conversely, if demand strengthens, the index could continue to rise above 5,265, potentially reaching 5,450. This would also yield positive outcomes for cryptocurrencies.
US Dollar Index (DXY)
Due to its inverse correlation with cryptocurrencies, the dollar index is another important indicator to watch closely. It also helps us understand the current macroeconomic situation. If the inflation data coming out on Wednesday does not meet expectations, the dollar may need to strengthen further.

The DXY experienced a sharp decline from the 105 resistance level on April 2, which was favorable for cryptocurrencies. The bulls maintain an advantage as the index has not slipped below the moving averages. Despite some weakness, key levels are being preserved. The current outlook suggests that, barring major macroeconomic triggers, the DXY could oscillate between 104 and 105 for a while.
A break above 105 could lead to a recovery towards 107, while a downturn in cryptocurrencies could be seen. In the opposite scenario, losing the 104 level could lead to a decline towards the 103 and 102 range.
Bitcoin Price Prediction
With only 11 days left until the block reward halving, the absence of a major price drop increases optimism for April 20. Many experts were concerned about deeper corrections 20 days before the halving. Bitcoin broke above the symmetrical triangle pattern on April 8, and it wouldn’t be surprising if it retests the $73,777 level in the coming hours.

The last ATH could serve as a strong resistance, but once surpassed, the target will be $84,000. If bears aim for deeper corrections, they will want to pull the price below the $68,335 20-day EMA soon. This could lead to a drop to $64,228 and $60,400.

 Türkçe
 Español


