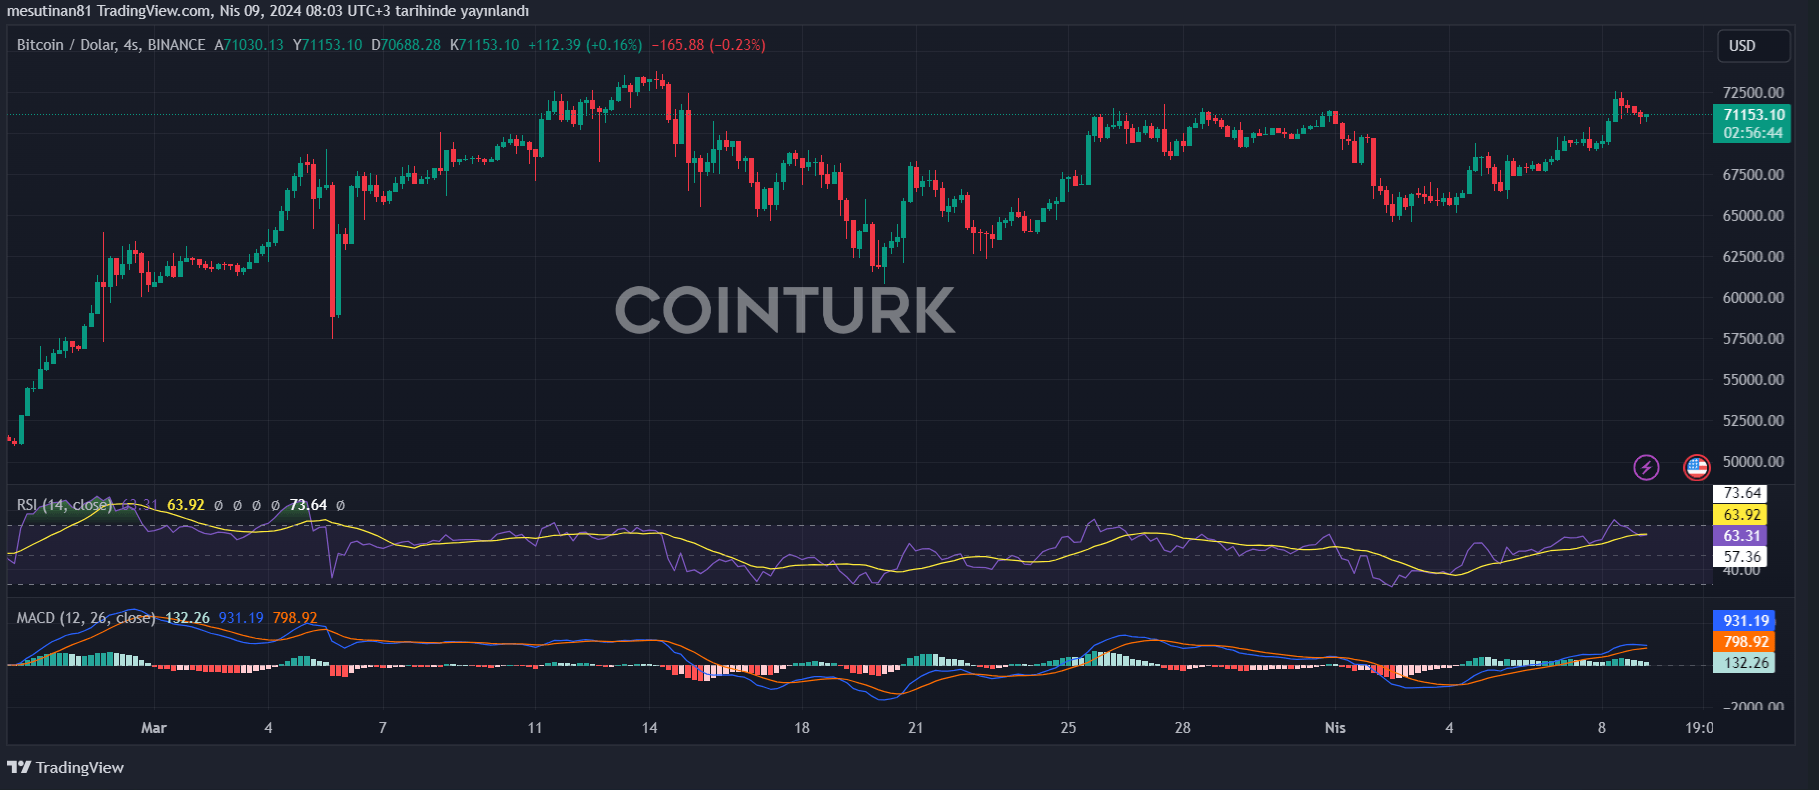
The recent volatility in the cryptocurrency markets is particularly noticeable with the rise in the price of Bitcoin. BTC has managed to climb above the resistance levels of $69,500 and $70,000, surpassing the $71,200 resistance as well. These developments indicate positive signals for Bitcoin and suggest that it could soon increase gains above $72,500.
Bitcoin’s Price Trend Points to an Uptick
The rising trend in Bitcoin’s price also shows that it is trading above $70,000 and the 100-hour Simple Moving Average. A significant uptrend line with support around $70,750 is also observed on the 4-hour chart of the BTC/USD pair. This situation points to a strengthening bullish trend in Bitcoin’s short-term outlook.

However, it is important not to overlook that the price is still encountering some resistance levels. The immediate resistance level is around $72,000, and if it is surpassed, larger resistance levels such as $72,500 and $72,800 will become significant. In particular, a clear move above the $72,800 resistance zone could signal the start of a new uptrend for Bitcoin.
Currently, it is anticipated that Bitcoin could rise towards $73,500 and even further towards the $75,000 resistance zone.
Potential Decline Expected if Bitcoin Fails to Break $72,000 Resistance
Bitcoin, if unable to break above the $72,000 resistance zone, may likely continue a downward trend. For now, Bitcoin’s immediate support point is at $70,750 or near the trend line. However, a close below these levels could see the price potentially retract to $70,350.
If this downward trend continues, the next significant support point is at the $70,000 level. A break below this level could rapidly send Bitcoin’s price down to $68,500 and even towards the $67,500 support zone with further losses.
What Do Technical Indicators Suggest?
According to technical indicators, the hourly MACD is currently losing momentum in the bullish zone, which could be interpreted as a sign of weakness in the price. The hourly RSI (Relative Strength Index) is hovering near the 50 level for BTC/USD, and while this indicator is not a standalone decision point, it is important for indicating overall market sentiment.
Key support levels stand at $70,750 and $70,000, while resistance levels are identified as $72,000, $72,500, and $73,500. Particularly, breaking the $72,000 resistance level could boost investor confidence and could lead to a renewed uptrend in price.

 Türkçe
 Español


