Due to Bitcoin’s (BTC) inability to surpass $69,000, investor confidence in Bitcoin has slightly decreased. However, the Bitcoin Rainbow chart revealed that BTC is actually mimicking the post-halving 2020 trend. Here are the details in cryptocurrency!
Critical Formation in Bitcoin
Bitcoin’s price volatility has decreased in the past few days. This situation has created a problem for BTC, which is struggling to exceed $69,000. However, it was noted that investor confidence is important as BTC is mimicking its behavior post-2020 halving. According to experts, months after the third halving, the Bitcoin Rainbow chart revealed that the token entered the buy zone. After staying in this zone for a few months, BTC’s price rapidly increased.
A similar trend was observed in BTC’s 2024 Rainbow chart. This indicates that the token is in the buy zone. If this is considered, it might be the last chance for investors to buy BTC at a lower price before it moves up into the accumulation and HODL zones. Experts then examined BTC’s on-chain metrics to see if investors are considering buying BTC as suggested by the Rainbow chart.

Exchanges Outflows in BTC
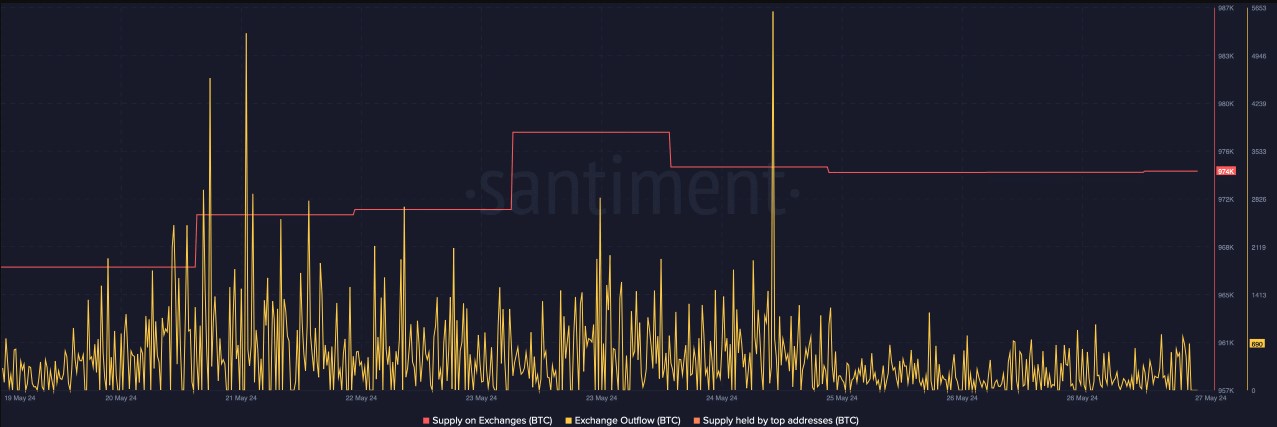
Exchange outflows decreased last week following the rise on May 24. The supply on exchanges increased, which may indicate that investors prefer to sell. According to CryptoQuant’s data, BTC’s net deposits on exchanges were high compared to the seven-day average, indicating high selling pressure.
Additionally, the decline in Coinbase Premium may suggest that selling sentiment is dominant among US investors. Due to the downward momentum of aSORP, investors followed the Bitcoin Rainbow chart. This may indicate that more investors are selling at a profit. After the bull market, this may suggest that the market has peaked. At the time of writing, BTC’s fear and greed index is at 74. This may indicate that the market is in the “greed” phase. When the metric reaches this level, it may signal a price correction.

 Türkçe
 Español


