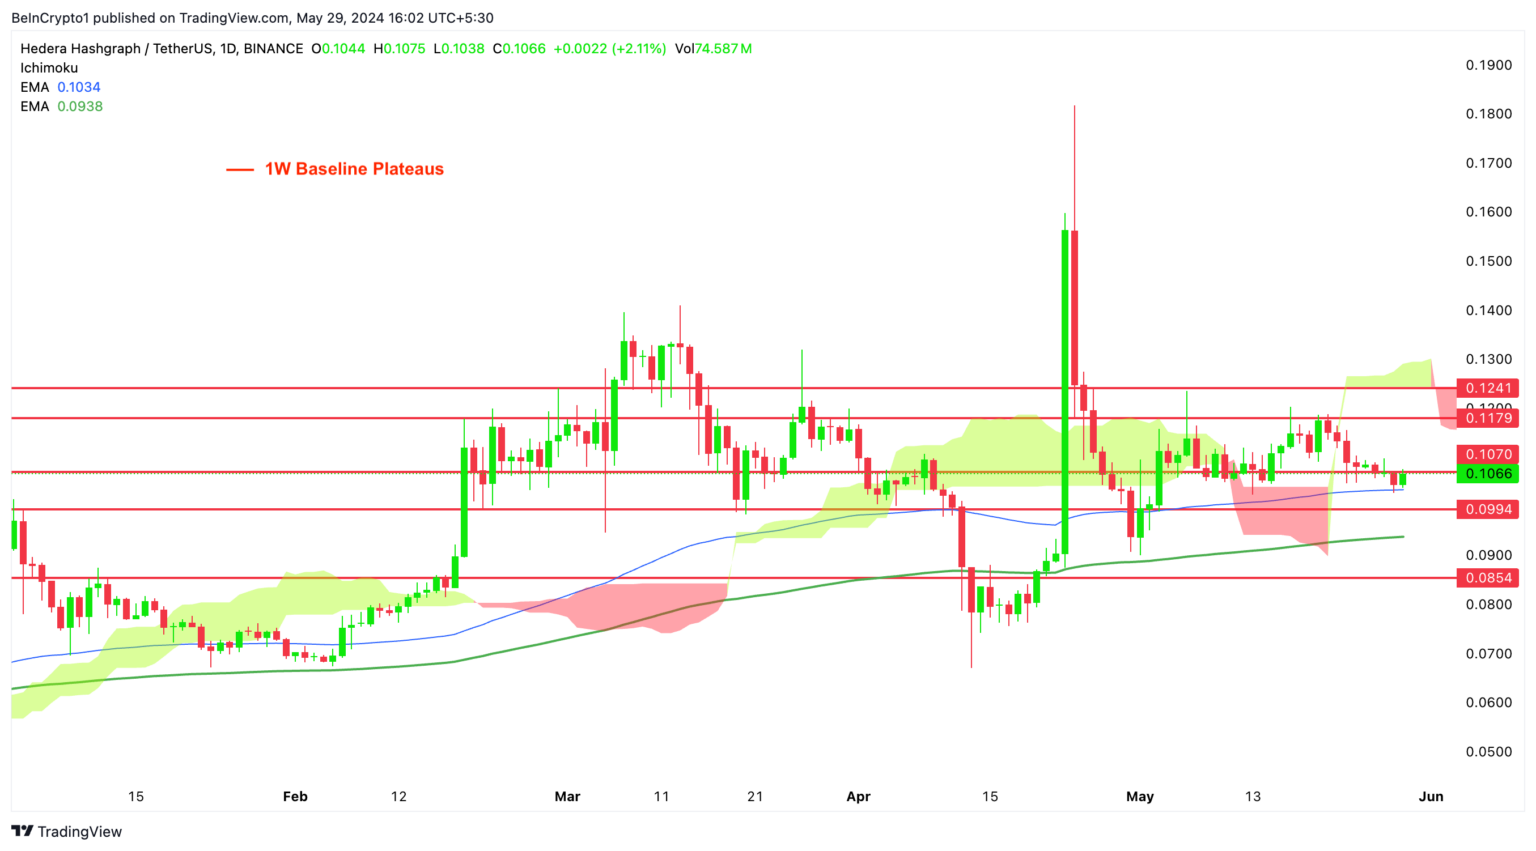
HBAR’s current price movement is crucial for investors seeking long-term trends. Daily analysis highlights key support and resistance levels that can determine future movements. On the daily timeframe, HBAR is trading above the 200-week EMA average. This level now serves as critical support that bulls need to maintain to sustain positive momentum.
Hedera Chart Analysis
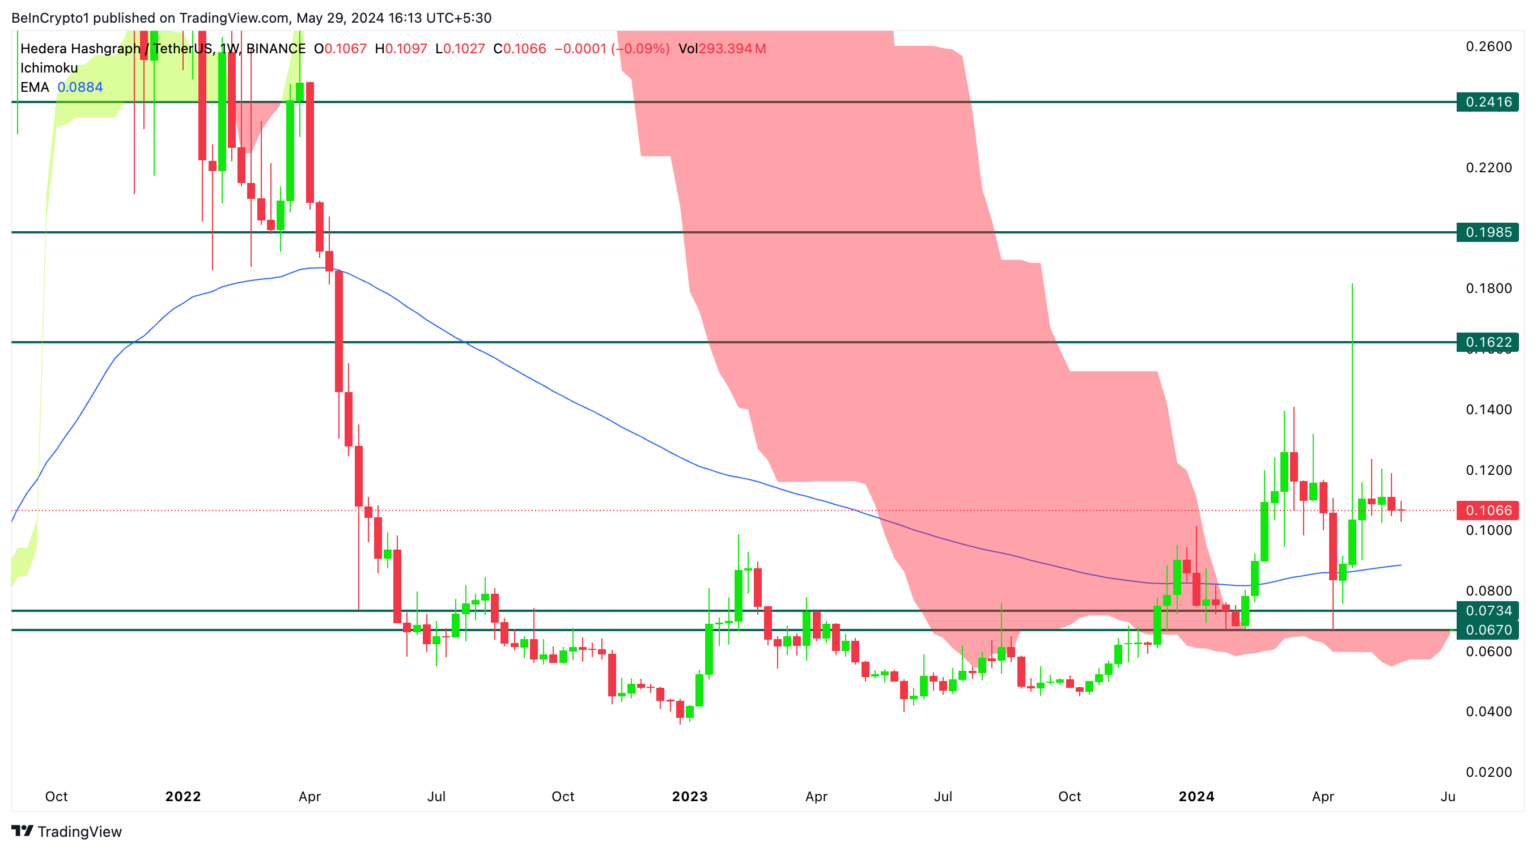
The HBAR/USDT pair is navigating a very important technical environment. Hedera price movement is influenced by key indicators, including the 100-day and 200-day exponential moving averages and significant weekly fundamental plateaus. Long-term support levels include $0.067 and $0.073. These have historically served as strong support, preventing further declines.

The long-term resistance levels to watch on a weekly basis are $0.162, representing a significant barrier to a potential major price breakout. This level is more important than those on the daily chart due to its long-term implications and provides more reliable signals for investors. The price is above the 200-day EMA average on the daily timeframe, indicating a bullish trend in the long-term trend. This level now serves as critical support that bulls need to maintain to sustain positive momentum.
The price is also trading slightly above the 100-day EMA average, indicating medium-term support. However, proximity to this EMA suggests potential volatility, emphasizing the importance of maintaining this level to avoid further downside risk.

Notable Details for Hedera
HBAR/USDT pair’s key resistance levels are $0.124, $0.118, and $0.107. These levels represent significant barriers where the price may face selling pressure. On the support side, critical levels to watch are $0.099, $0.090, and $0.085.
These levels are important for indicating where the price may find buying interest and potentially recover. The Ichimoku Cloud serves as an indicator of future support and resistance zones. The current price position below the cloud indicates a neutral to slightly bearish trend.

 Türkçe
 Español


