Bitcoin experienced a modest increase in the last 24 hours, rising by approximately 1.5% to $61,700 as of June 28. This upward movement is supported by the resumption of inflows into Bitcoin exchange-traded funds and broader gains in the cryptocurrency market, bolstered by VanEck’s Solana ETF application.
Why is Bitcoin Rising?
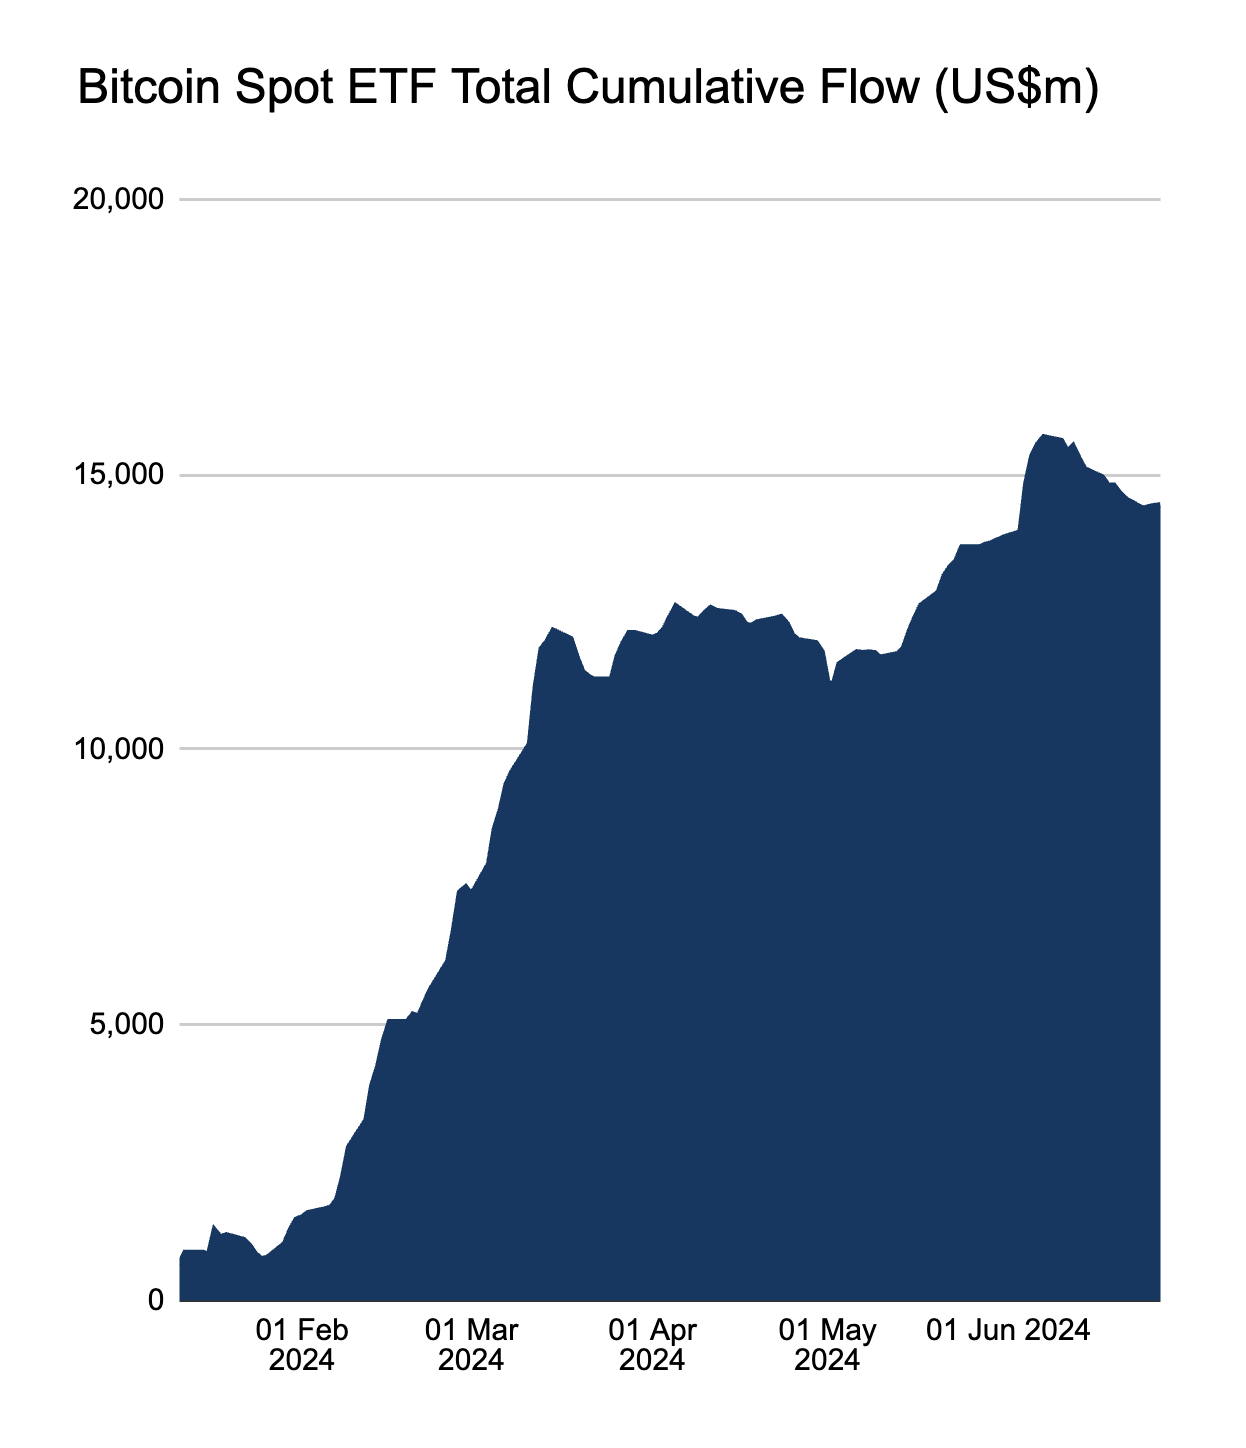
Today’s Bitcoin rise follows three consecutive days of inflows into US-based Bitcoin ETF funds, indicating a revived risk appetite after a week of outflows. As of June 27, these Bitcoin ETF funds managed assets worth $14.44 billion, up from the low of $14.383 billion set three days earlier. However, at their peak on June 6, these funds held $15.68 billion.

Bitcoin and the rest of the crypto market received positive signals after VanEck applied for a new Solana ETF spot in the United States. The Wall Street firm currently has two pending crypto ETF applications with the US Securities and Exchange Commission.
Bitcoin Chart Analysis
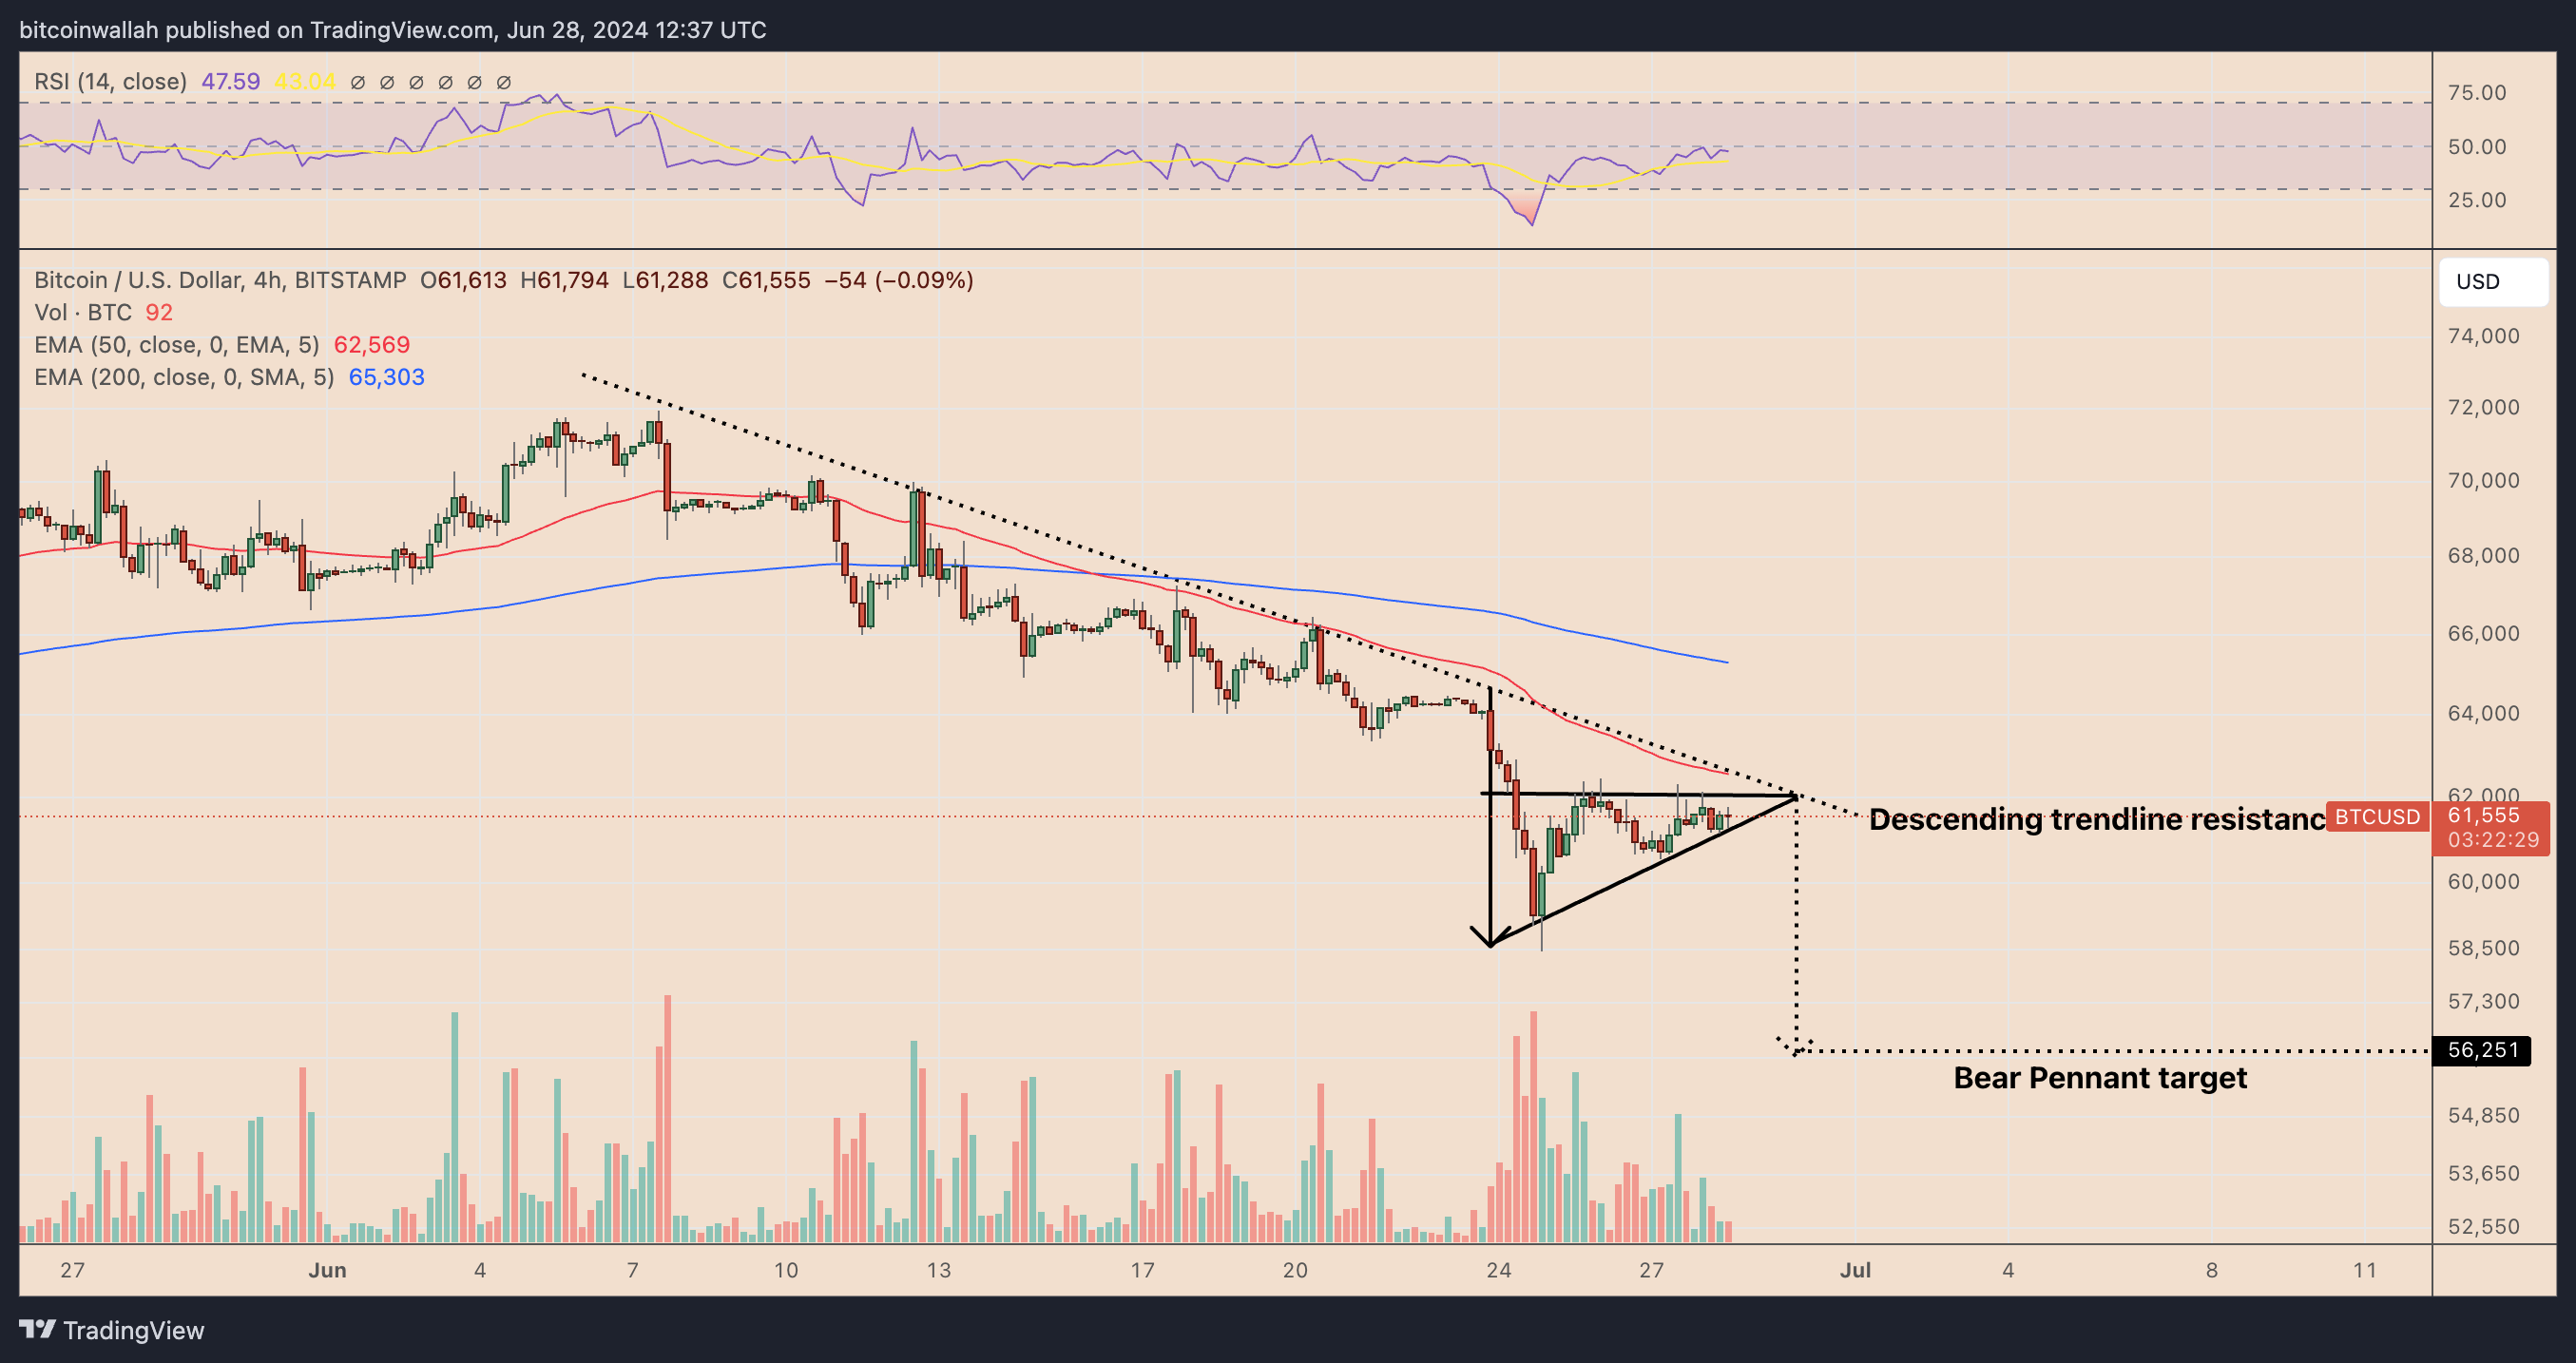
Today’s Bitcoin rise is part of the price volatility within the prevailing consolidation trend. Interestingly, this pattern appears to be forming a pennant, which increases the potential for a continued downtrend in the context of Bitcoin’s previous downward movement.

A bearish pennant resolves when the price breaks below the lower trendline and falls by the height of the previous downtrend. Applying the same technical rule to Bitcoin’s ongoing price trends sets the July downside target at $56,250, approximately an 8.5% drop from current price levels.
Bitcoin’s breakout potential is further heightened by two strong resistance levels: the 50 exponential moving average on the 4-hour chart (50-4 hour EMA; red line) and the descending trendline. Both align around $62,000, the upper trendline of the pennant. However, a decisive break above this resistance cluster could completely invalidate the bearish pennant and bring Bitcoin’s price to around $65,000, the 200 EMA on the 4-hour chart (blue line).


