At the time of writing, the Bitcoin (BTC) price stands at $59,160, having dropped to $57,701 in the last 24 hours. This week, BTC has tested below $58,000 multiple times. When will the months-long discouraging price movement end? What levels should investors watch for BTC?
Bitcoin (BTC)
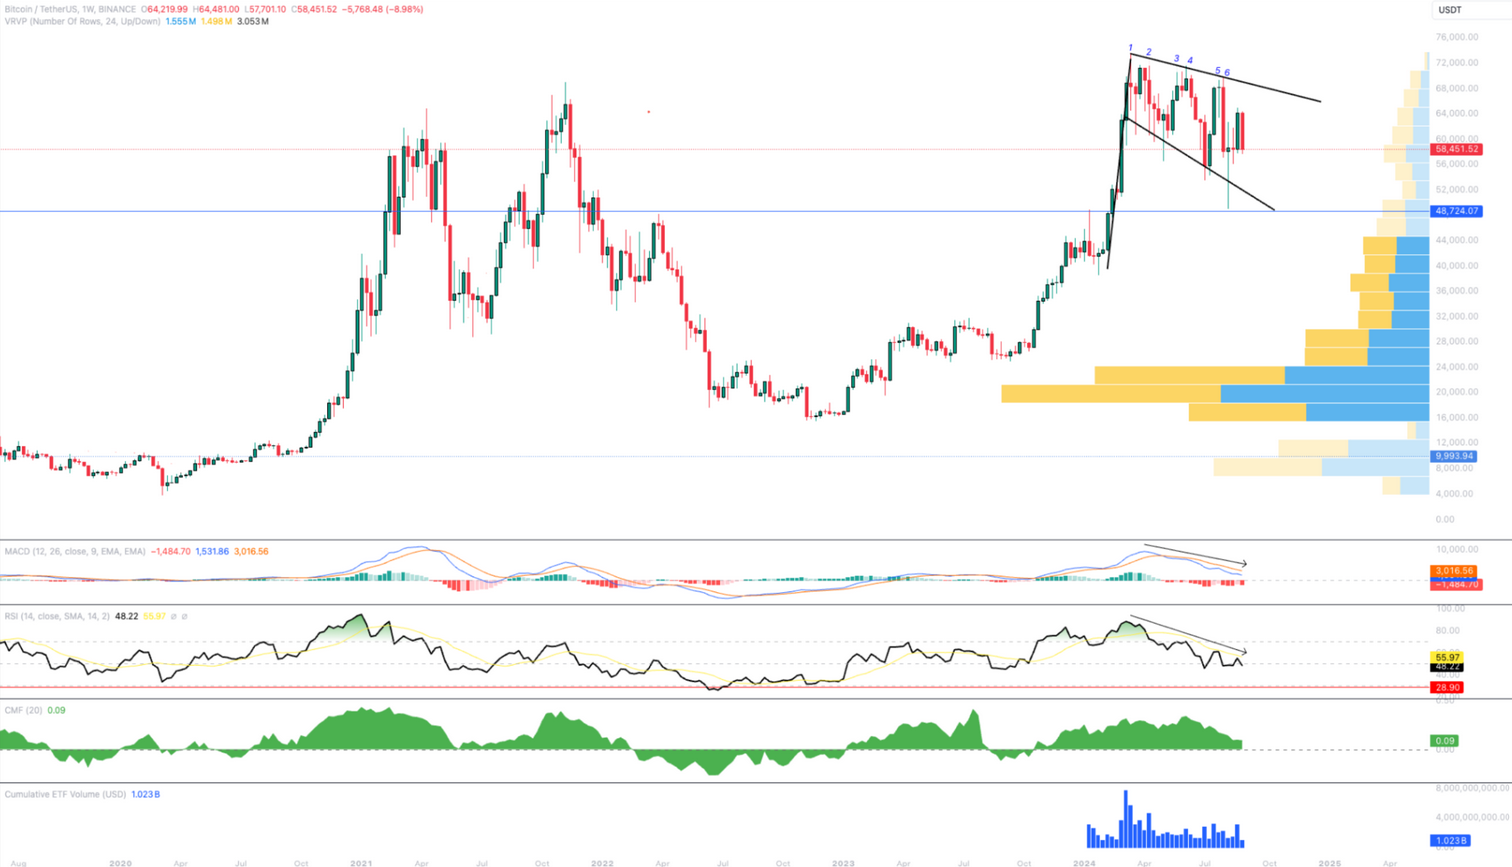
Two formations stand out on the weekly BTC chart. Meanwhile, Glassnode analysts have termed the ongoing situation for the past five months as a “structurally adjusted downtrend.” This reflects the weakness in BTC price momentum. Crypto analyst Skew highlights the connection between sharp fluctuations in the chart and strong liquidations in futures trading.
Looking at the total current order books, spot bids are temporarily preventing a sharper decline. However, the weakening of spot buying at higher levels also hinders significant upward movements. This triggers sharp movements in both directions.
On the technical front, a formation that can vary between a bull and an expanding wedge is forming. This suggests that accumulation between $52,000 and $48,000 and a selling trend between $62,000 and $67,000 could be profitable. Since liquidations in futures are triggered in both directions, a break of either $48,000 or $67,000 will be necessary at some point.

On the weekly chart, BTC continues to make lower highs instead of testing new highs. As the distance between the MACD and the signal line widens, we might see signs of a loss series similar to 2018 and 2021. Similarly, the RSI climbed to 88.47 in March when the spot price reached its ATH level, then fell to 44 in August.
Crypto is now a much more global asset, and macroeconomic and geopolitical developments remind us of different triggers beyond its internal dynamics with rises and falls. This supports the idea that investors may experience periods different from previous cycles.
BTC and Volume
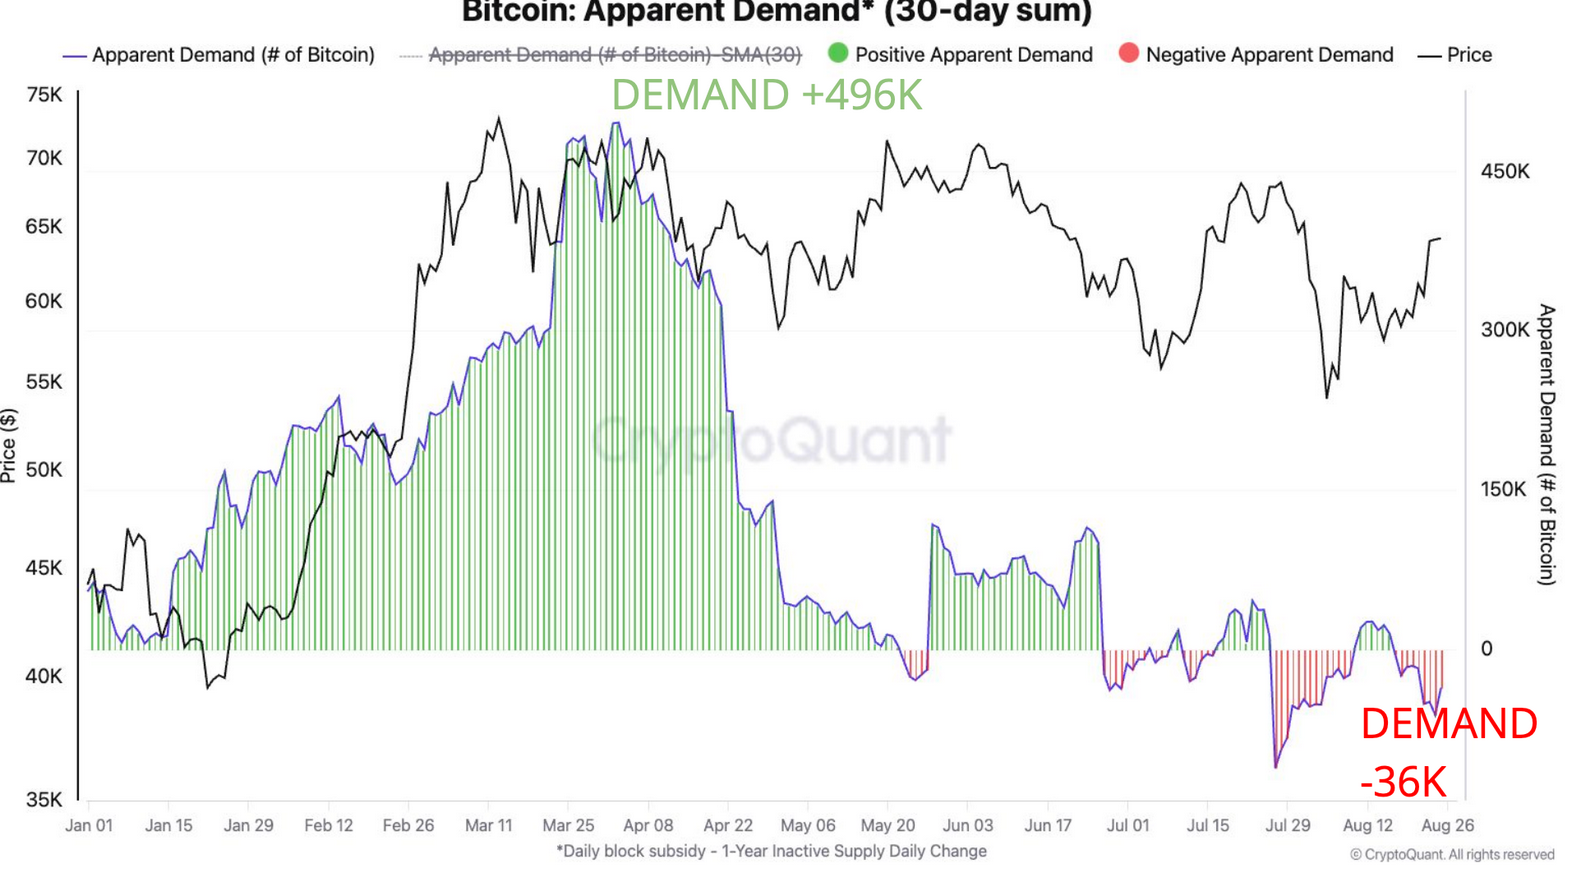
CryptoQuant reports highlight the long-standing lack of volume often associated with the summer months. According to CryptoQuant, Visible Demand is the difference between the daily total Bitcoin block subsidy and the daily change in the amount of Bitcoin that has remained unchanged for a year or more. The report mentions a significant relaxation in Visible Demand.
“Demand has declined from the 496,000 Bitcoin 30-day growth, the highest since January 2021, to the current negative growth of 36,000. As demand slows, prices have also fallen from around $70,000 to $49,000.”


 Türkçe
 Español


