ARK Invest stated in a report that due to various macroeconomic issues such as interest rates, GDP forecasts, unemployment, and inflation, cryptocurrencies may continue to face adverse winds for the rest of 2023. Can Bitcoin‘s range-bound movement increase selling pressure on altcoins? Let’s examine the Bitcoin and Ethereum charts to find out.
Bitcoin (BTC)
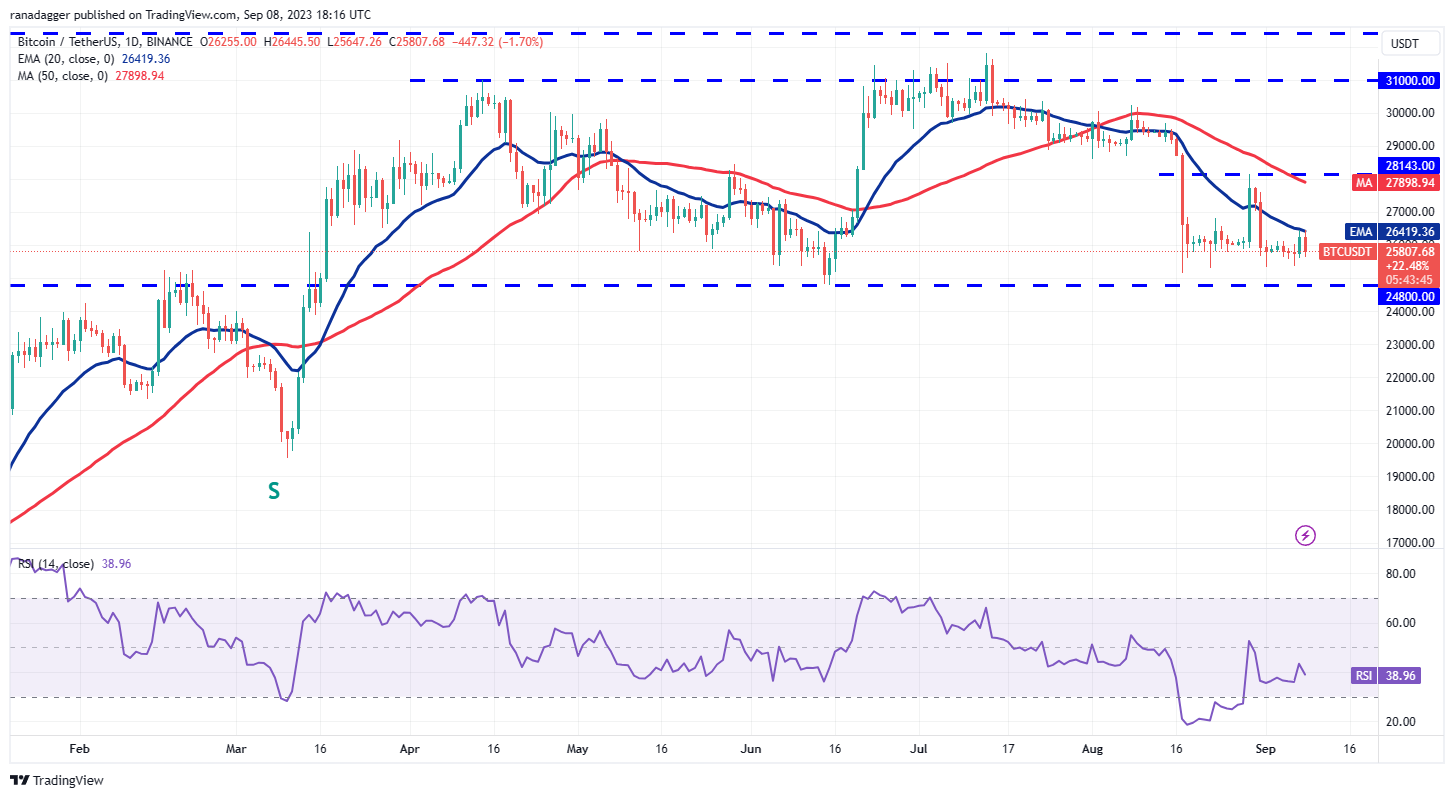
Bitcoin reached the 20-day exponential moving average (EMA) of $26,419 on September 7. However, the bulls failed to overcome this hurdle. This indicates that the bears strongly defended the 20-day EMA. However, the failure of the bears to challenge the critical support level of $24,800 may indicate that the selling pressure has subsided at lower levels. The relative strength index (RSI) is attempting to form a positive divergence, indicating a weakening bearish momentum. The first sign of strength in BTC could be a breakout and close above the 20-day EMA, which could pave the way for a sustainable recovery towards $28,143. On the contrary, if the support at $24,800 is breached, the BTC/USDT pair could initiate a downtrend. There is a minor support at $24,000, but it may not halt the decline. The BTC/USDT pair could then reach the significant support at $20,000.

Ethereum (ETH)
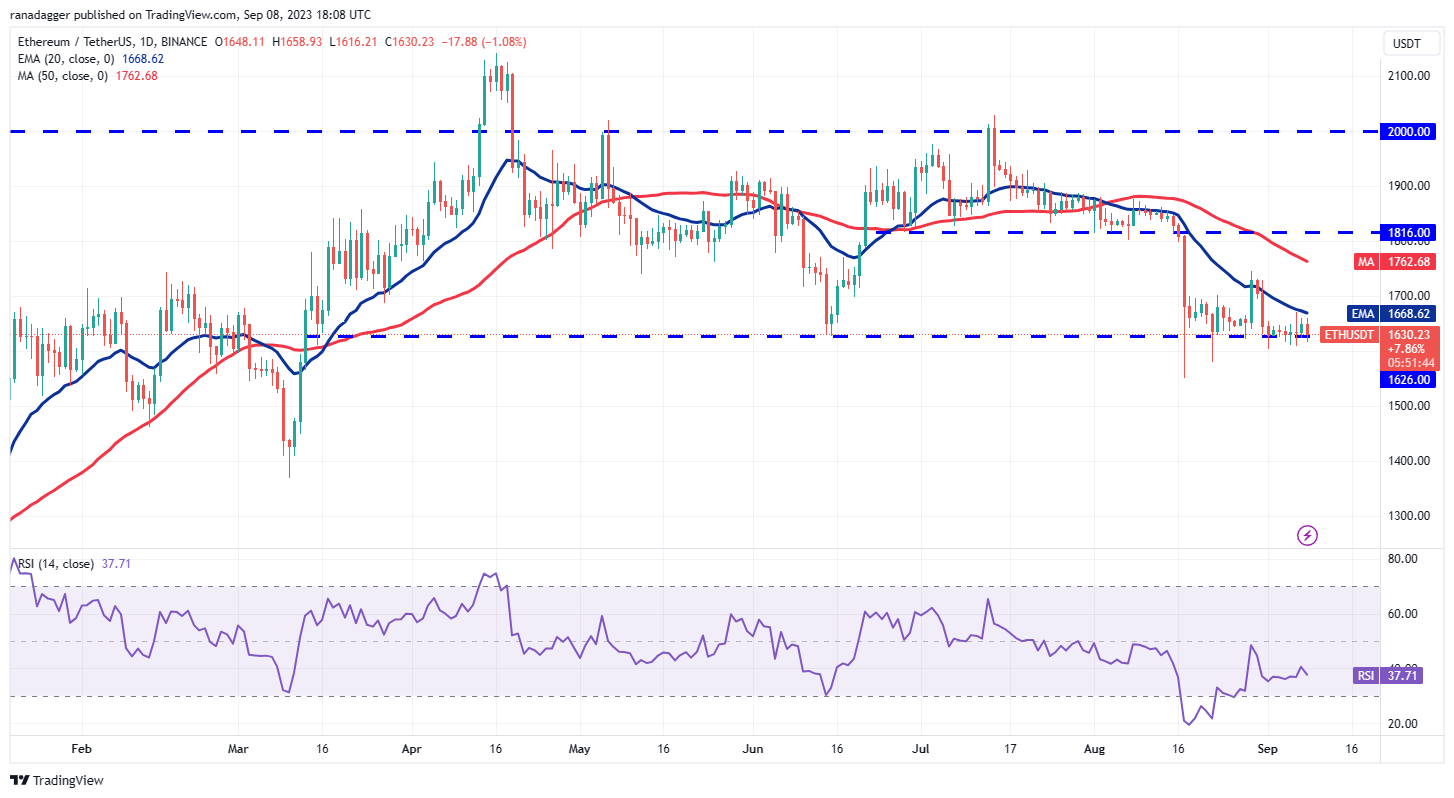
Ethereum continues to trade within a narrow range between the 20-day EMA and the strong support at $1,626. The inability of the bulls to overcome the overall resistance at the 20-day EMA increases the risk of a breakdown. Below $1,626, the ETH/USDT pair could retest the intraday low of $1,550 on August 17. Buyers may aggressively buy the dip towards this level, as a break below support could lead the pair to $1,368. Time is running out for the bulls. If they want to prevent a collapse, they may need to first push the price above the 20-day EMA and then attempt a rise towards the 50-day simple moving average (SMA) at $1,762. This could increase the probability of the pair staying within the range of $2,000 to $1,626 for a few more days.


 Türkçe
 Español


