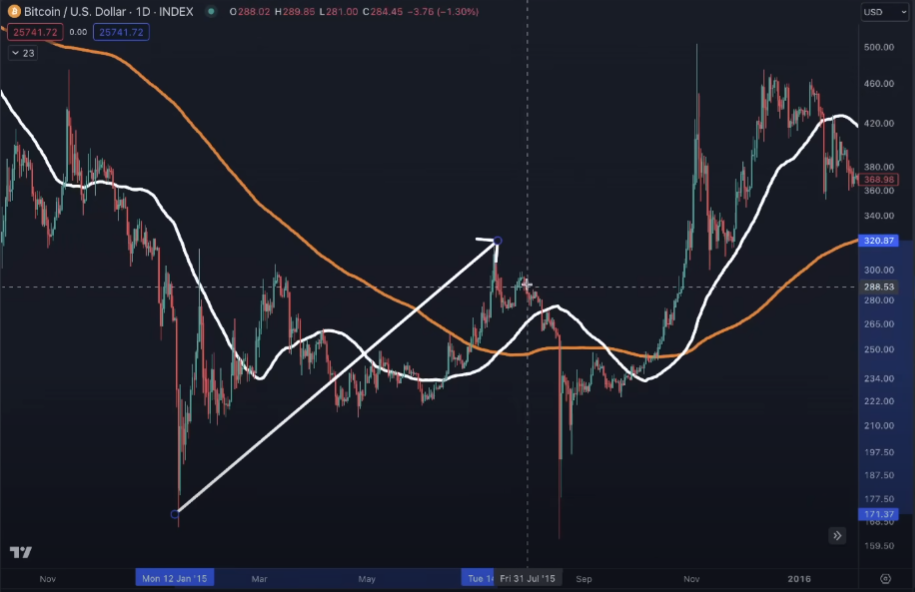
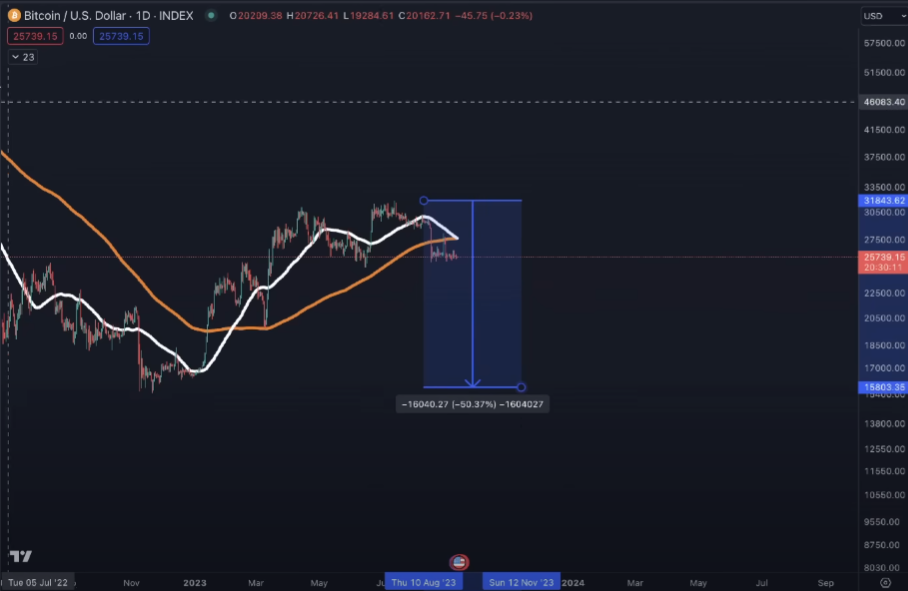
Leading cryptocurrency analyst Benjamin Cowen, closely followed by cryptocurrency investors, has stated that the largest cryptocurrency Bitcoin (BTC) may be repeating the price movements of 2015, when it collapsed after showing significant volatility.
Bitcoin’s Terrifying “2015” Repeat
Experienced cryptocurrency analyst Benjamin Cowen, known for his accurate predictions, stated that BTC’s strong rally earlier this year could be a repeat of the price movements in 2015. Cowen highlighted that Bitcoin started from an extremely low level of around $150 and rose to over $300 in just a few months, doubling its value. The analyst expressed this similarity with the following words:
There was a 2x rally in 2015, followed by a 50% drop. Today, there was a 2x rally, and it didn’t have a 3x to 4x rally like we saw in 2019. It had a 2x rally, and in terms of the size of the rally, it looks more like 2015.

Cowen warned investors that if Bitcoin repeats the bearish market structure of 2015, it could experience a significant 50% drop. He said:
After this major 2x rally, the price needs to go down and form a double bottom. Imagine that you forget about the falling tops and bottoms and think that buyers didn’t take action when the last bottom level was broken. So, imagine that when the price of Bitcoin drops below the bottom at $24,800, no buyers take action.
This means it’s a big problem, just like what happened in 2015 when the price started to drop. Buyers didn’t take action until the price reached the previous bottom level. Then there was a 50% drop. Today, a 50% drop from $31,000 would allow Bitcoin’s price to reach the previous bottom level, thus forming a double bottom formation similar to 2015.
Another Signal Indicating a Decline in Bitcoin: Death Cross
Cowen’s warning came after Bitcoin formed a Death Cross on the daily chart. A Death Cross occurs when a short-term moving average (MA) falls below a long-term MA.

Investors and traders typically consider a Death Cross as an ominous signal of a significant decline, as it indicates a reversal from an uptrend to a downtrend. The price chart shared by the analyst shows a tendency for the 50-day MA (white line) to fall below the 200-day MA (orange line), indicating the formation of a Death Cross in the price chart of the largest cryptocurrency in its early stages.

 Türkçe
 Español


