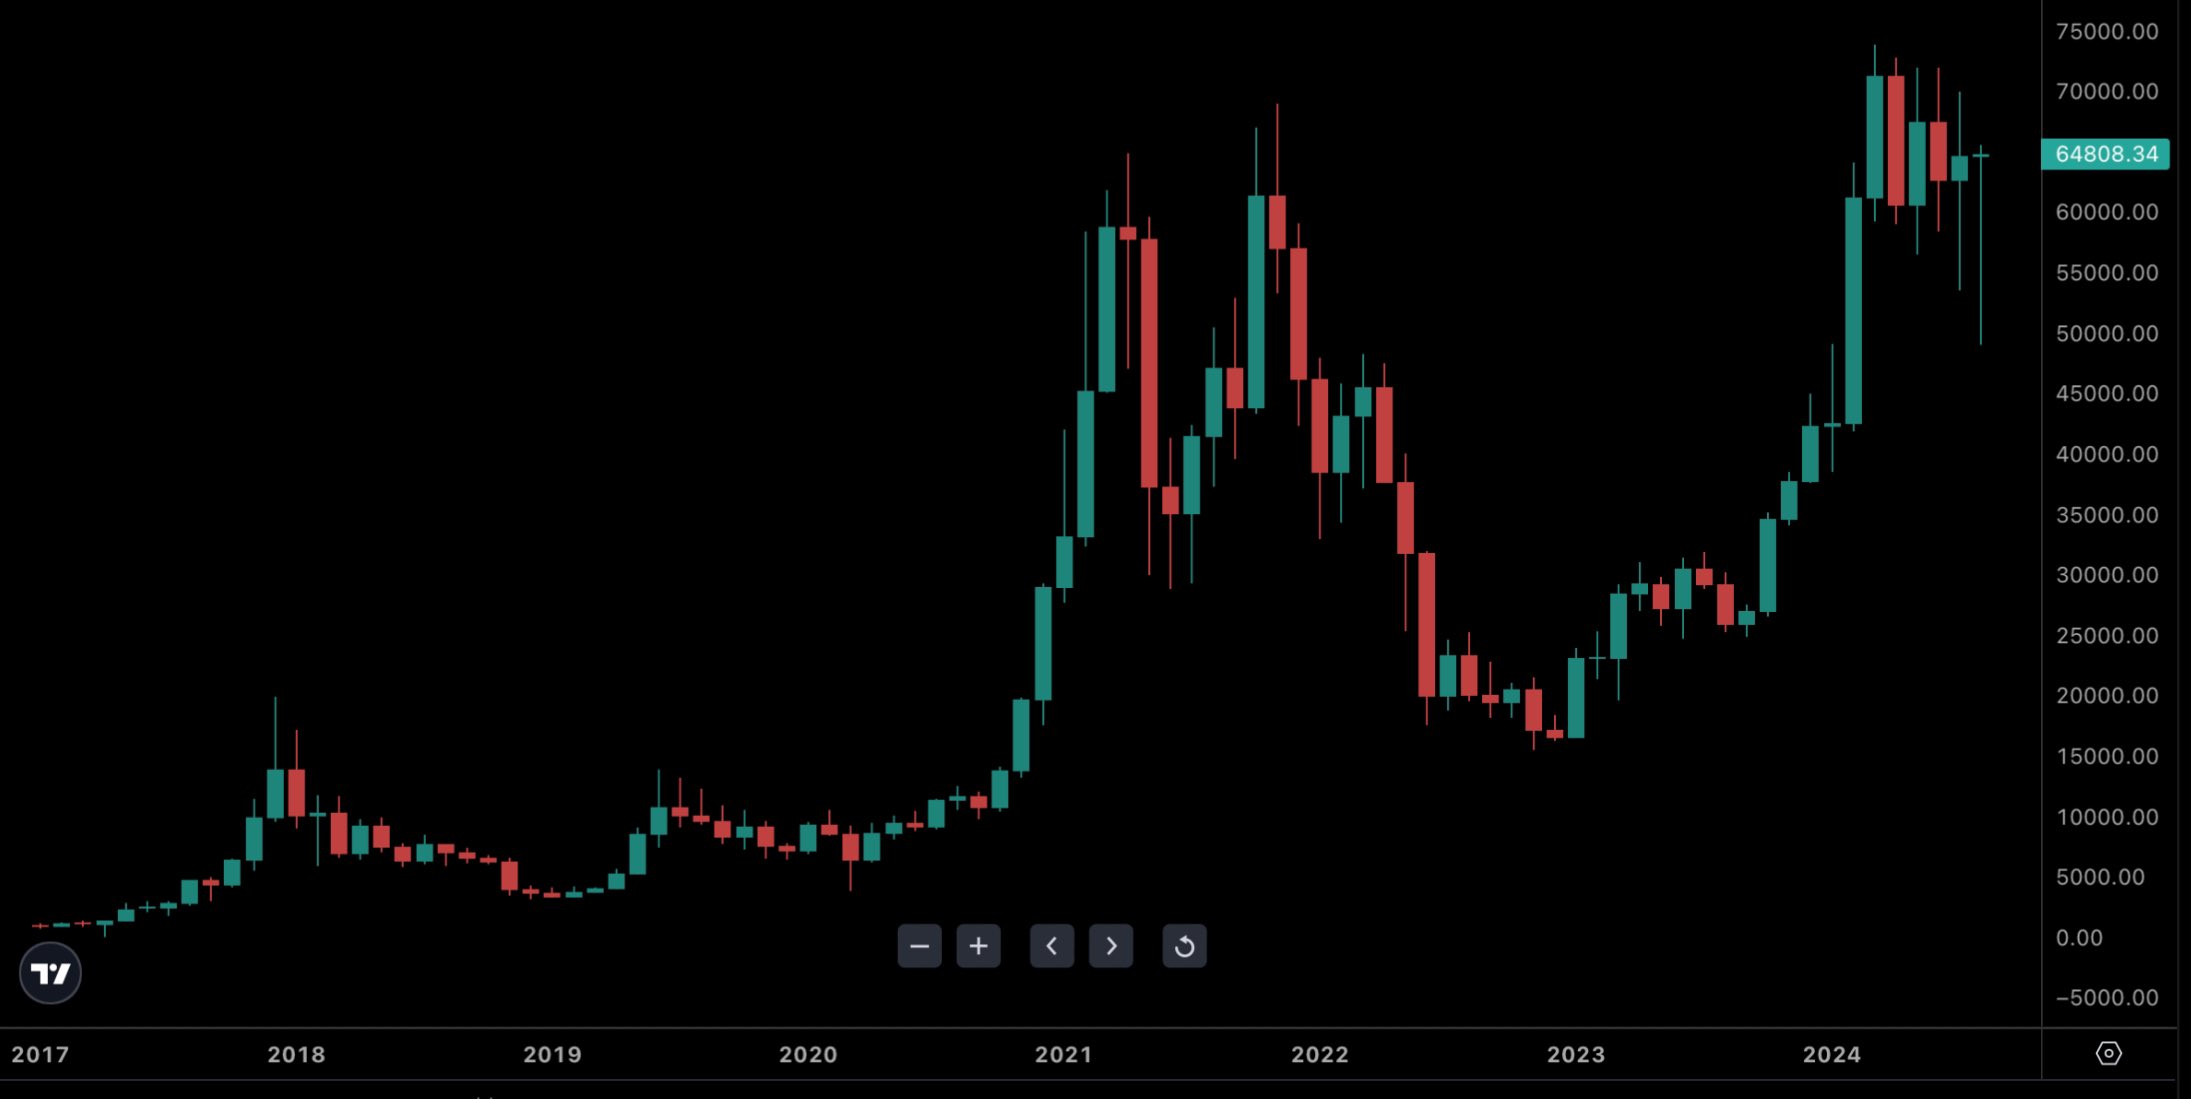
According to an analyst, the end of August could produce a very interesting monthly candle on the Bitcoin chart and signal a potential trend reversal. However, others warn that the month is not over yet and fundamental factors are more likely to have a greater impact on market movements.
Notable Development in Monthly Chart
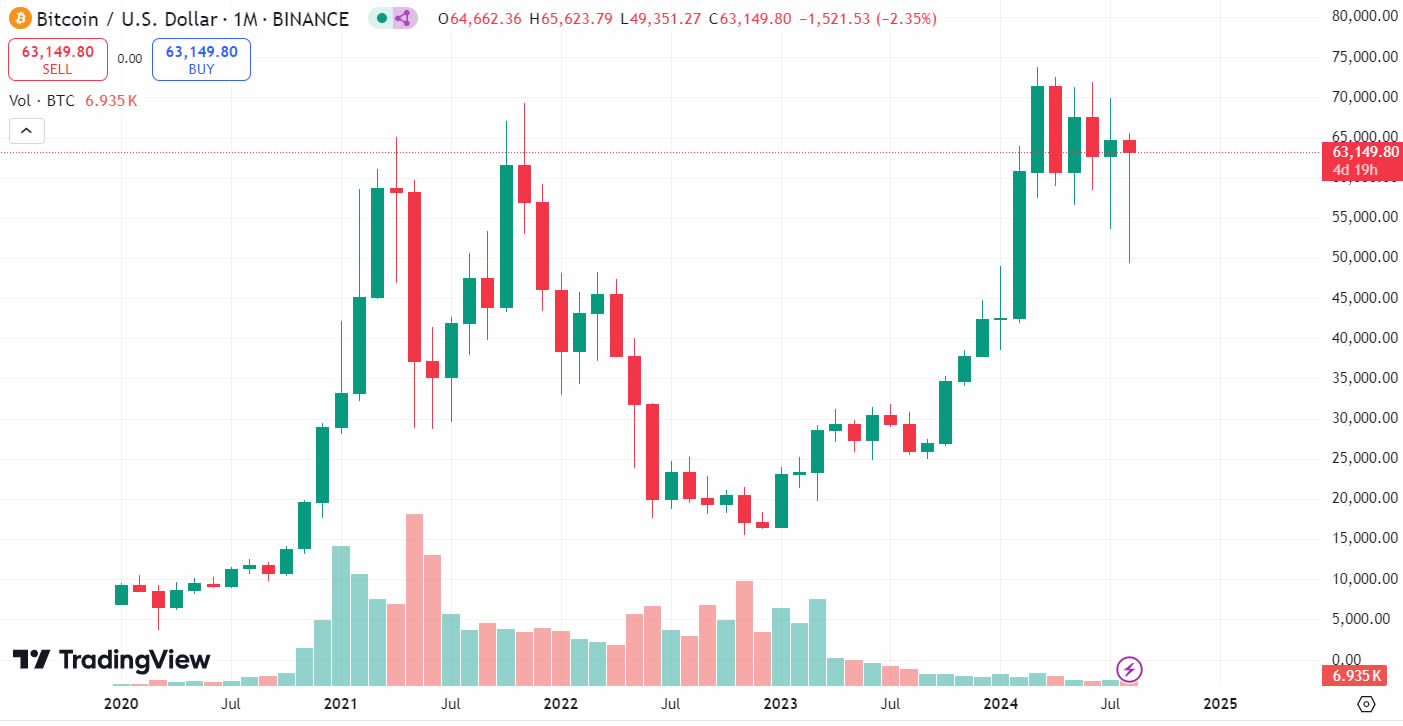
In a post published on X on August 26, analyst HODL15Capital stated that this is arguably the most interesting monthly candle in Bitcoin’s history. The analyst referred to the formation of a Japanese candlestick known as a dragonfly doji on the monthly time frame chart.

A dragonfly doji is a candlestick pattern that can signal a potential price reversal based on past price action. Speaking on the matter, FXPro senior analyst Alex Kuptsikevich said that the dragonfly formation on Bitcoin’s monthly chart reflects optimism about a recovery after the failure at the beginning of the month and added:
“Potentially, it is a sign of the reversal of the negative trend we saw after the all-time high in March.”
However, he warned that it is important to remember that the month is not over yet and it is not entirely accurate to confirm the formation of a pattern. Kuptsikevich shared the following statements on the matter:
“We saw the strength of the bulls in Bitcoin when it was bought back sharply after a failure in the weekly time frame at the beginning of the month.”
The analyst said that a second breakout above the all-time high around $74,000 would push the price into uncharted territory, with the potential for rapid growth to the $110,000 level. However, he warned that Bitcoin could also enter a long consolidation before the rise.
Details on the Matter
Meanwhile, Apollo Crypto analyst Henrik Andersson was not convinced by the technical signal and argued that fundamentals and sentiment drive the market:
“The short and medium term will likely be driven by interest rate cuts and election forecasts.”
At the time of writing, Bitcoin price had fallen 1.2% daily to trade at $63,150. According to Tradingview, this caused the dragonfly doji to turn into a hammer candle on the monthly time frame. However, the hammer is also known for bullish reversal patterns that appear at the bottom of downtrends.


