While market uncertainty persists, XRP is also feeling its effects. Despite this uncertain environment, a crypto analyst suggested that the critical resistance level seen in XRP will be broken, leading to new highs. The analyst excited investors by sharing several technical indicators pointing to a potential trend reversal in XRP.
XRP Chart and Analyst Commentary
Recently, an analyst named ‘Dark Defender’ made a notable post on X, sharing an intriguing analysis about XRP’s price.
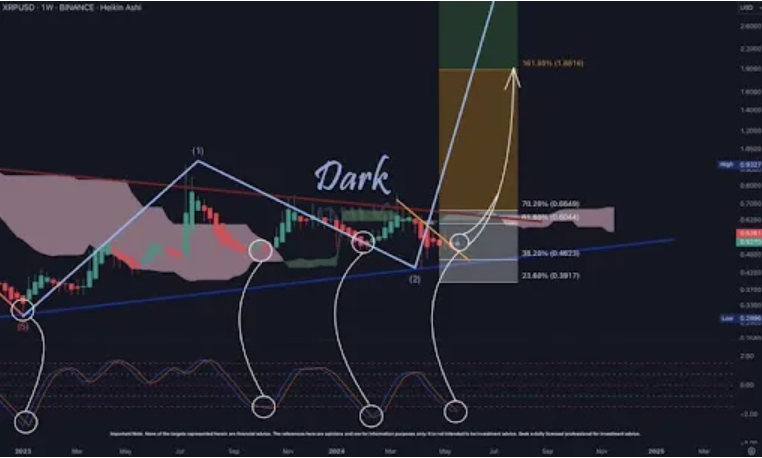
Supporting his analysis with Heikin Ashi Candles and the Fisher Indicator, Dark Defender noted that the connection between these two technical indicators generally emphasizes a trend change on a weekly timeframe.
While predicting XRP, the analyst shared a chart showing XRP’s price movements from 2023 to the end of 2024. He highlighted a crucial support zone between $0.6044 and $0.6649 that XRP must break through to experience a price increase.
In the shared chart, the analyst pointed to the period between July and September, showing investors a price target of $1.88 and stating that the cryptocurrency would need to rise by 161.8% to reach this price.

Dark Defender mentioned that for the predicted price movements to become a reality, XRP’s weekly candle view must occur above $0.6649.
Will XRP Price Rise?
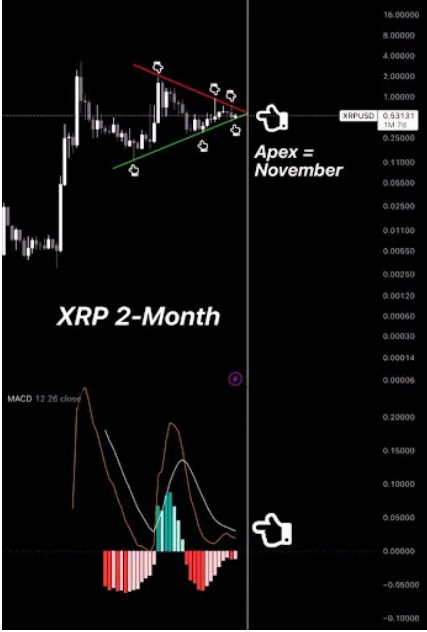
Another crypto analyst known as ‘JT’ on X highlighted a very important level in XRP, suggesting that the altcoin could experience explosive momentum before November 2024. According to the analyst, there is a large triangle formation in XRP’s price chart, which he noted is the longest-standing triangle formation in the crypto market.

According to JT, the current formation in XRP could meet a peak in November, potentially leading to a breakout for the cryptocurrency. The analyst suggested that if an upward movement is seen in the Moving Average Convergence Divergence (MACD), XRP’s price could rise.
As of the time of writing, XRP is trading at $0.5337, following a 1% increase in the last 24 hours.

 Türkçe
 Español


