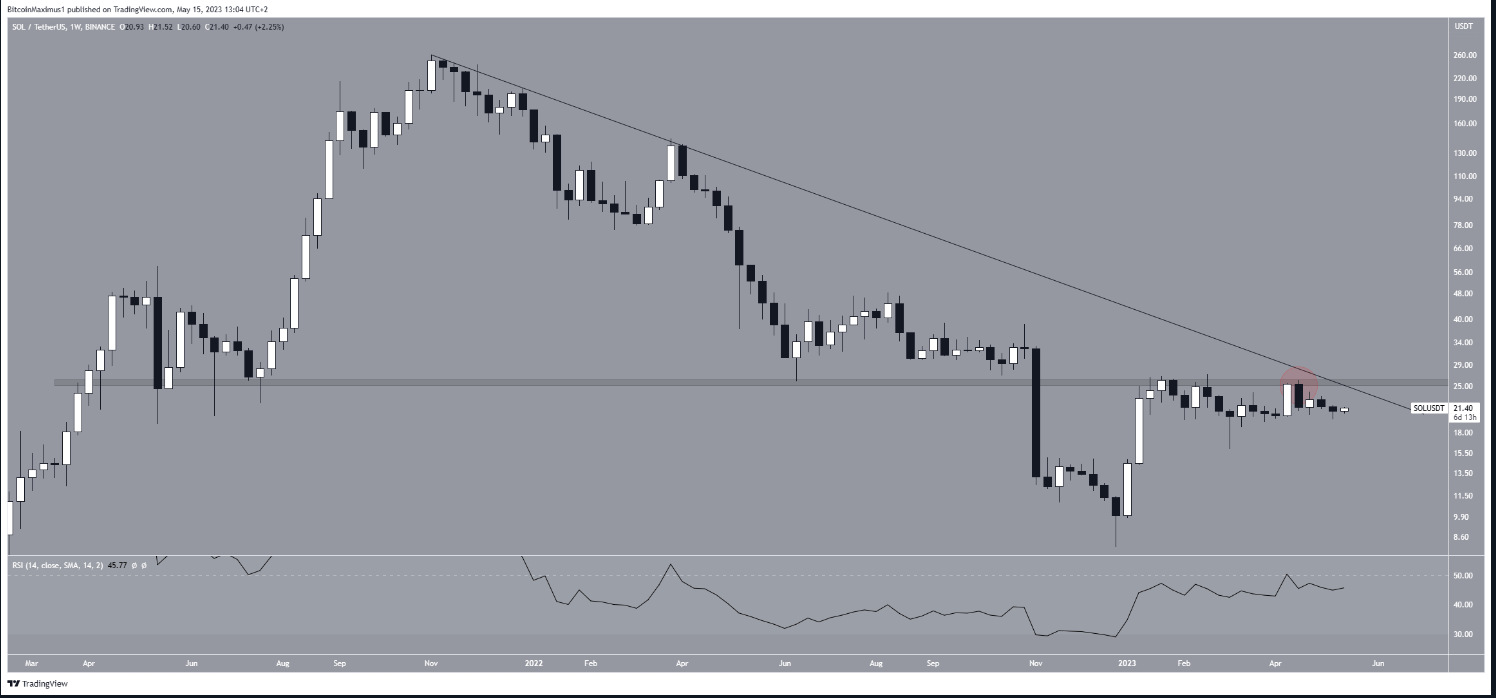
Despite failing to break above important long-term resistance levels, according to analysts, Solana (SOL) price is trading inside a short-term bullish pattern. In this pattern, analysts state that they expect a short-term rise, but long-term forecasts are not clear.
SOL Technical Analysis
The price of SOL has fallen below a long-term descending resistance line since reaching its all-time high price in November 2021. Since the line has been in place for such a long time, as long as SOL is trading below this line, the trend can be considered bearish, according to analysts.
At the moment, however, the line also coincides with the long-term $26 resistance level. Therefore, the importance of this line is considered to be more certain. Analysts also note that recently, in April, the SOL price was rejected by the confluence of these levels.

The Weekly Relative Strength Index (RSI), on the other hand, is generating mixed reviews. RSI can be described as a momentum indicator that traders use to assess whether a market is overbought or oversold and to determine whether to accumulate or sell an asset.
Readings above 50 and a bullish bias indicate that bulls still have the advantage, while readings below 50 indicate the opposite. Even though the indicator is below 50, it has been increasing since the beginning of the year.
SOL Price Comments
Technical analysis and price action on the six-hour timeframe shows that SOL price has been falling in a descending wedge since April 16. The descending wedge is considered a bullish pattern, meaning it often leads to a breakout.
On May 11, the price bounced at the confluence of support levels formed by the support line of the wedge, the $20 horizontal support area and the 0.618 Fib retracement support level.
On the other hand, when multiple support methods align at the same level, the significance of the level increases. The strong bounce confirmed the validity of the level. As a result, according to analysts, the trend can be considered bullish as long as the price is trading above this level and bearish as long as it is below it.


