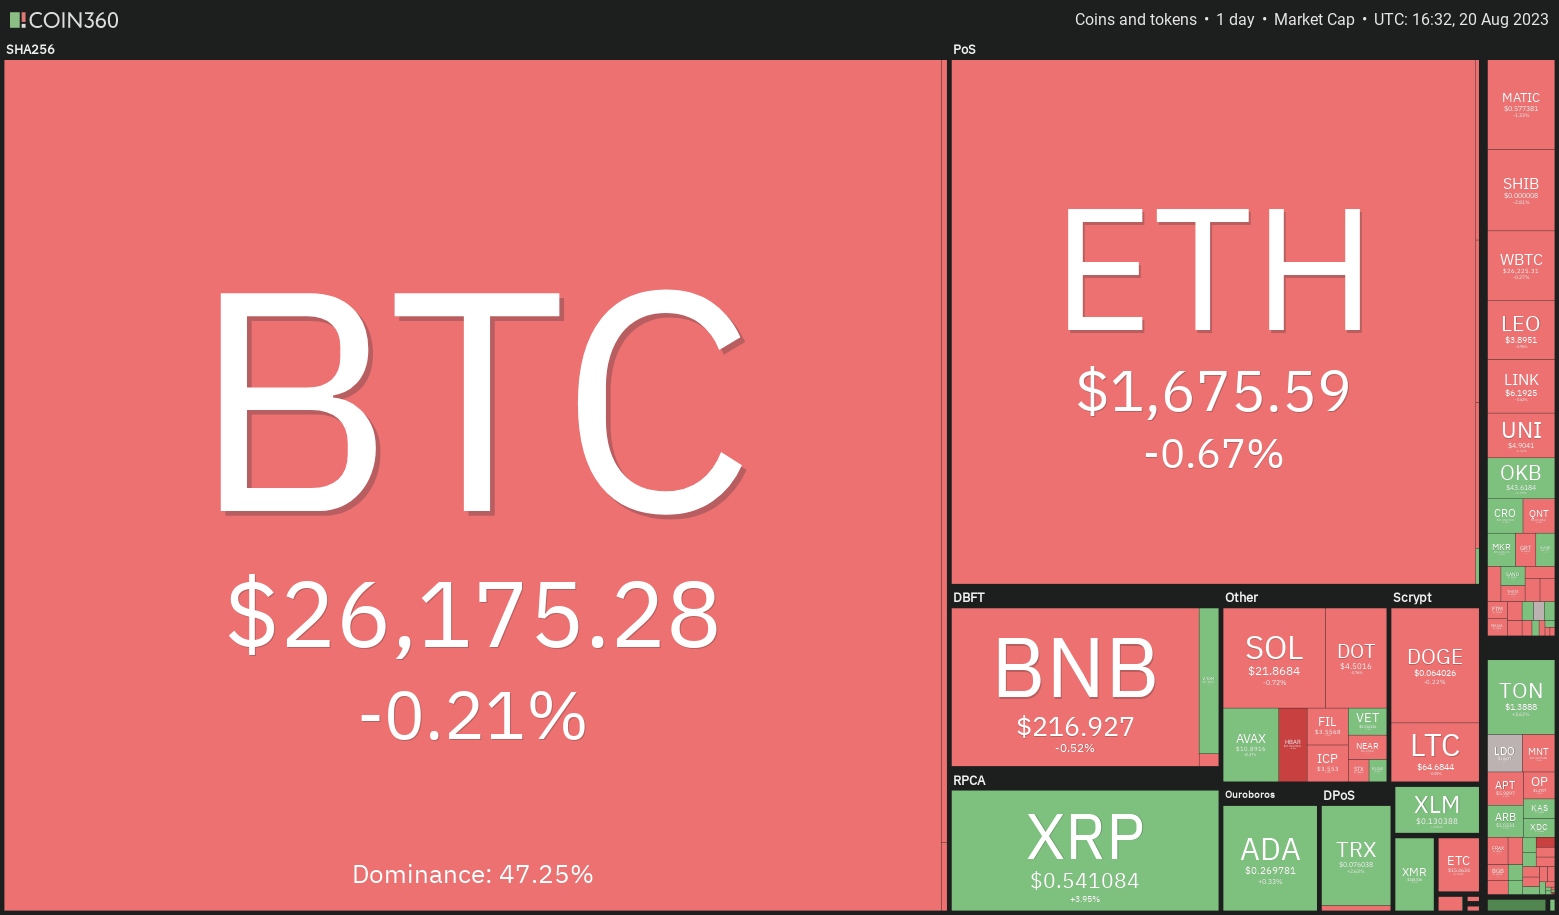
Investor sentiment took a downturn after the rise of Bitcoin, experiencing an 11% decrease last week. While Bitcoin found support at $25,000, many analysts are warning of another drop towards $20,000.
The weakness is not limited to the cryptocurrency markets alone. The US stock markets also faced a week of losses, with the S&P 500 Index falling by 2.1% and the Nasdaq Composite Index dropping by approximately 2.6%. Both indexes recorded a three-week losing streak, indicating that investors are in risk-averse mode in the short term.

The drop in Bitcoin pulled down several altcoins, indicating a widespread sell-off. However, there are a few altcoins that stand out by bouncing off strong support levels or continuing their upward movements. Let’s examine the charts of three cryptocurrencies that may break the negative trend and remain positive in the next few days.
Hedera Price Analysis
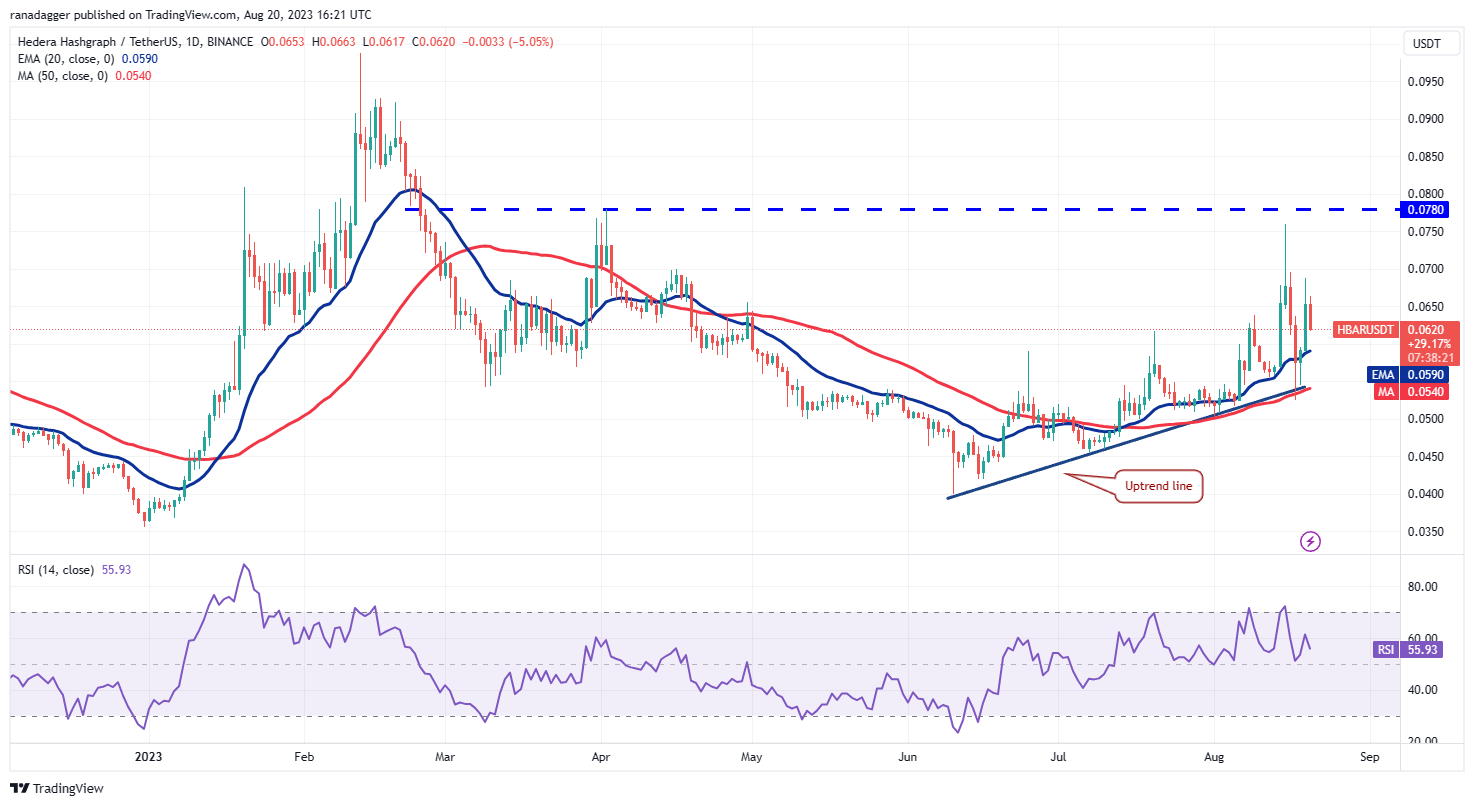
The reversal of Hedera’s price from the $0.078 general resistance on August 15 shows that bears are active at higher levels. However, a small advantage for bulls was the buying of the dip at the 50-day SMA level of $0.054.

Both moving averages are upward sloping, and the RSI is in the positive zone, indicating that buyers have the upper hand. Bulls will once again attempt to push the HBAR/USDT pair to the $0.078 general resistance. If this obstacle is overcome, the pair could rise to $0.093 and eventually $0.099.
On the contrary, if the price falls and goes below the 20-day EMA, it will indicate that bears are continuing to sell. The pair could then retest the support of the uptrend line and a break below this level could open the doors for a drop to $0.045 and then $0.040.
Optimism Price Analysis
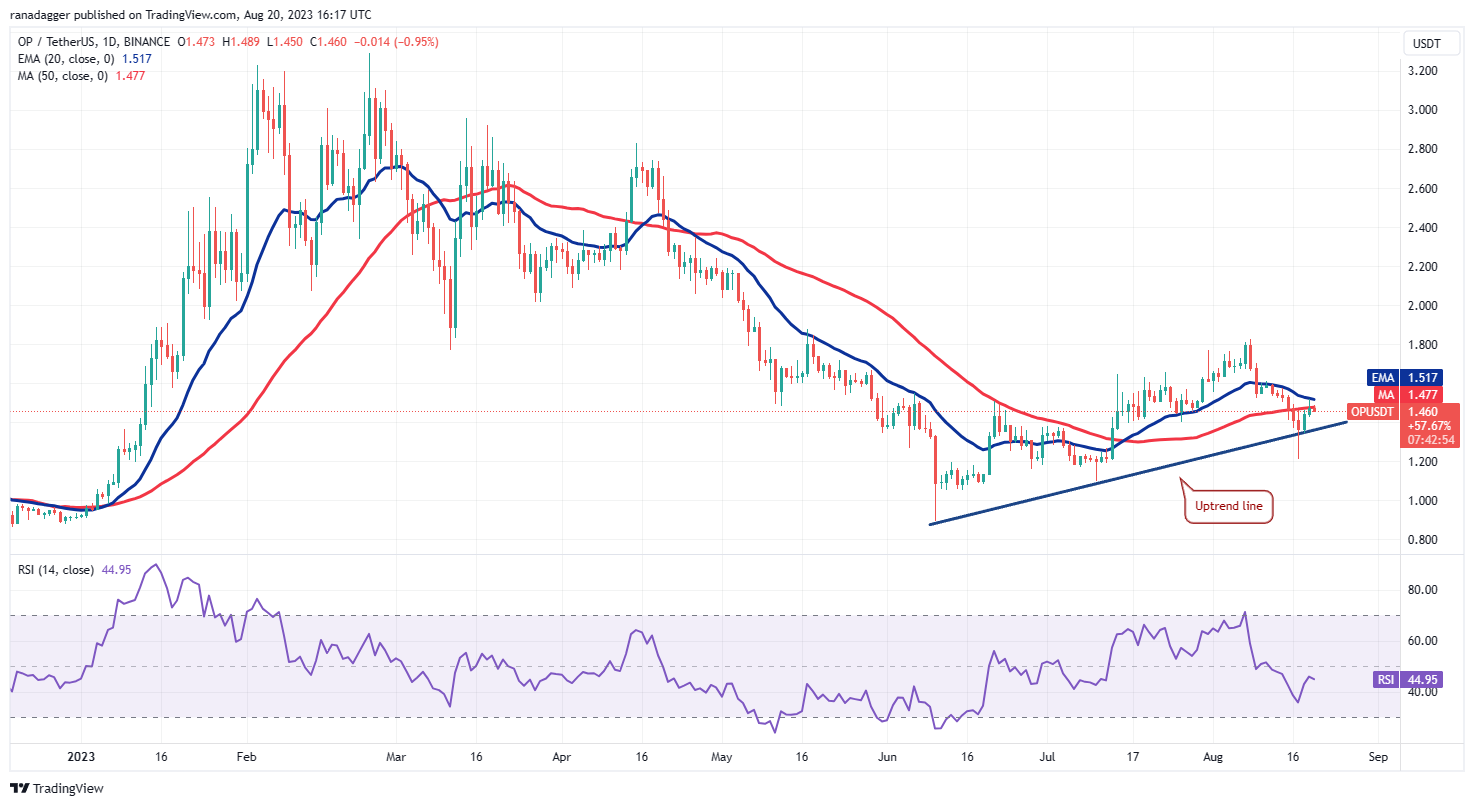
Optimism (OP) fell below the moving averages but found support at the uptrend line, indicating demand at lower levels.

The price bounced off the uptrend line but is facing resistance at the 20-day EMA level of $1.51. If the price does not fall below the uptrend line, it will increase the likelihood of a rally above the 20-day EMA. If this happens, the OP/USDT pair could rise to the $1.88 general resistance.
Contrary to this assumption, if the price falls and goes below the uptrend line, we could see bears taking control. The OP price could then drop to $1.21 and then $1.09.
Injective Price Analysis
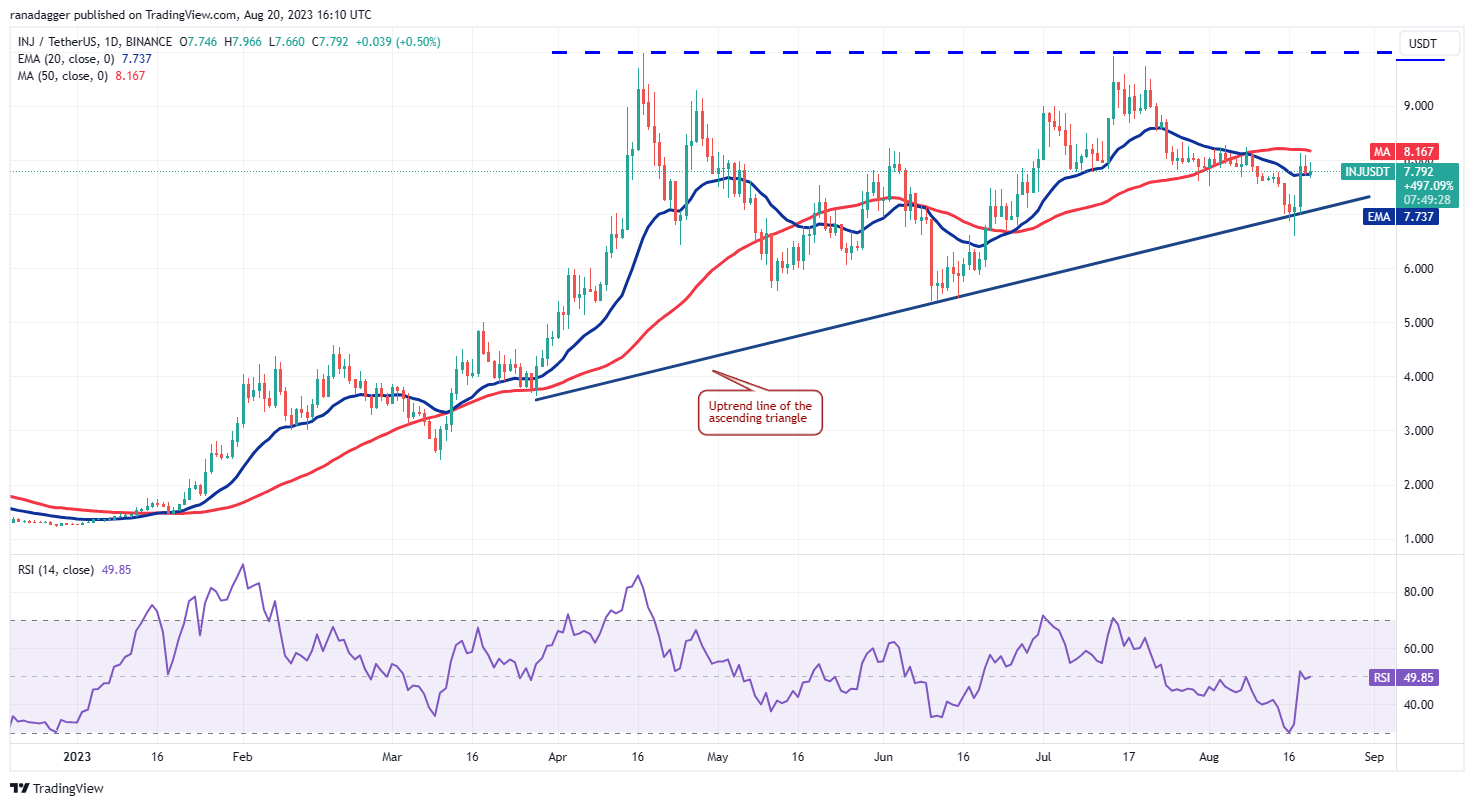
The recent price action of Injective (INJ) formed a rising triangle pattern, indicating a slight advantage for buyers.

Bears pulled the price below the uptrend line of the triangle on August 17, but the long tail on the candlestick indicates strong buying at lower levels. Bulls pushed the price above the 20-day EMA level of $7.73 on August 18 and have successfully held this level since then, indicating their attempt to turn the 20-day EMA into support.
If the price manages to rise above the 50-day SMA level of $8.16, it could indicate that bulls are back in control. This could pave the way for a potential rally towards $10. However, this bullish view could be invalidated if the price falls and goes below the uptrend line. In that case, the INJ/USDT pair could drop to $5.40.


