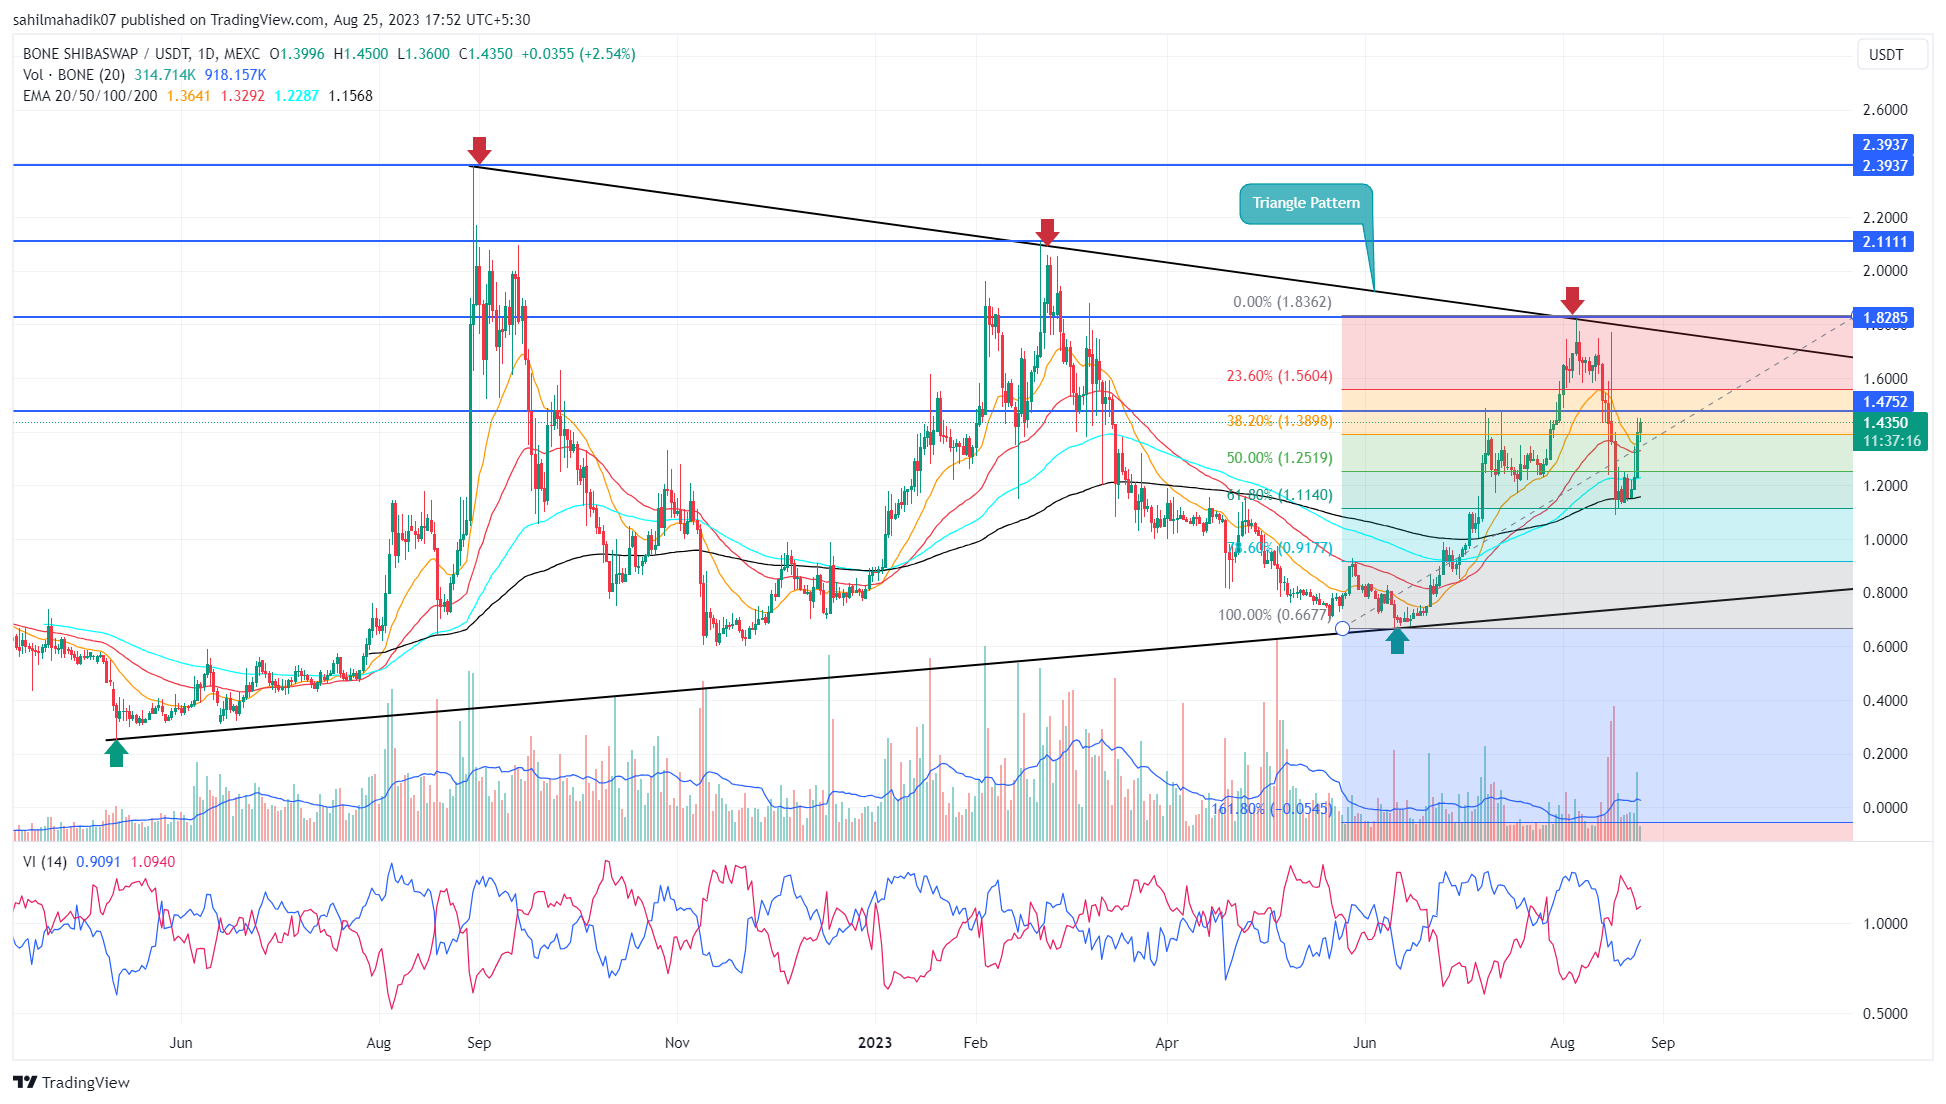
Over the past 15 months, Bone ShibaSwap (BONE) has been moving within a horizontal trend determined by the boundaries of a symmetrical triangle formation. The most important feature of this formation is its ability to keep price movements within two converging trend lines. Specifically, BONE’s price has demonstrated significant impact on the formation’s price behavior by rebounding twice from the lower trend line and three times from the upper trend line. Now let’s take a look at how this chart pattern will potentially affect BONE’s price in the short term.
Bone ShibaSwap Price Analysis
Due to the highly anticipated launch of Shibarium, Shiba Inu’s (SHIB) most talked-about altcoin in August was undoubtedly Bone ShibaSwap. However, amid the downward trend seen throughout the month, BONE’s price faced a decline. The price of the altcoin dropped sharply by 39% to $1.1 after reaching its highest level of $1.82 throughout the month.

Amidst the uncertainty affecting the overall cryptocurrency market, BONE’s price found support at the 61.8% Fibonacci retracement level. This marked a significant turning point with a 26.5% increase in price, eventually reaching its current valuation of $1.40.
If the current upward momentum continues, market participants may have a chance to surpass the overall resistance at $1.47. A successful breakthrough from this resistance could increase the altcoin’s price by 18% and potentially break the upper trend line of the symmetrical triangle formation. Successfully surpassing this significant barrier would indicate a promising change and potentially lead to reaching the initial targets of $2.1 and $2.39, respectively, signaling the start of a new bull trend.
Could the Downward Price Trend of BONE Continue?
While BONE’s price shows upward momentum, it is important to note that the price is approaching the upper trend line of the symmetrical triangle formation. At this point, expected selling pressure may hinder further progress. If market sentiment weakness persists, this altcoin could experience a downward reversal from dynamic resistance, triggering a new downward trend.
The daily time frame price chart of the altcoin reflects increasing buying momentum with the approaching bullish crossover in the Vortex Indicator’s V+ (blue) and VI- (orange) slopes. Furthermore, the 200-day EMA indicates a more horizontal price movement for BONE.

 Türkçe
 Español


