Due to the recent negative news flow and regulatory pressure from the United States in particular, the cryptocurrency market is experiencing its longest bearish period. The combination of low volatility and declining trading volumes is making this period quite dull, leading investors to continue preferring more reliable investment instruments instead of the cryptocurrency market. Especially with Bitcoin falling below $30,000, the altcoin market is also being negatively affected. Let’s analyze DOGE chart.
DOGE Daily Chart Analysis
The lack of any positive or negative news flow regarding Dogecoin, the most valuable meme token in the cryptocurrency market, is currently reflected in its price. Despite the numerous speculations that have made headlines with incredible claims in relation to corporate changes on Twitter, no steps have been taken for DOGE yet. Although DOGE has experienced incredible price surges due to posts by Elon Musk in the past, it continues to remain silent these days.
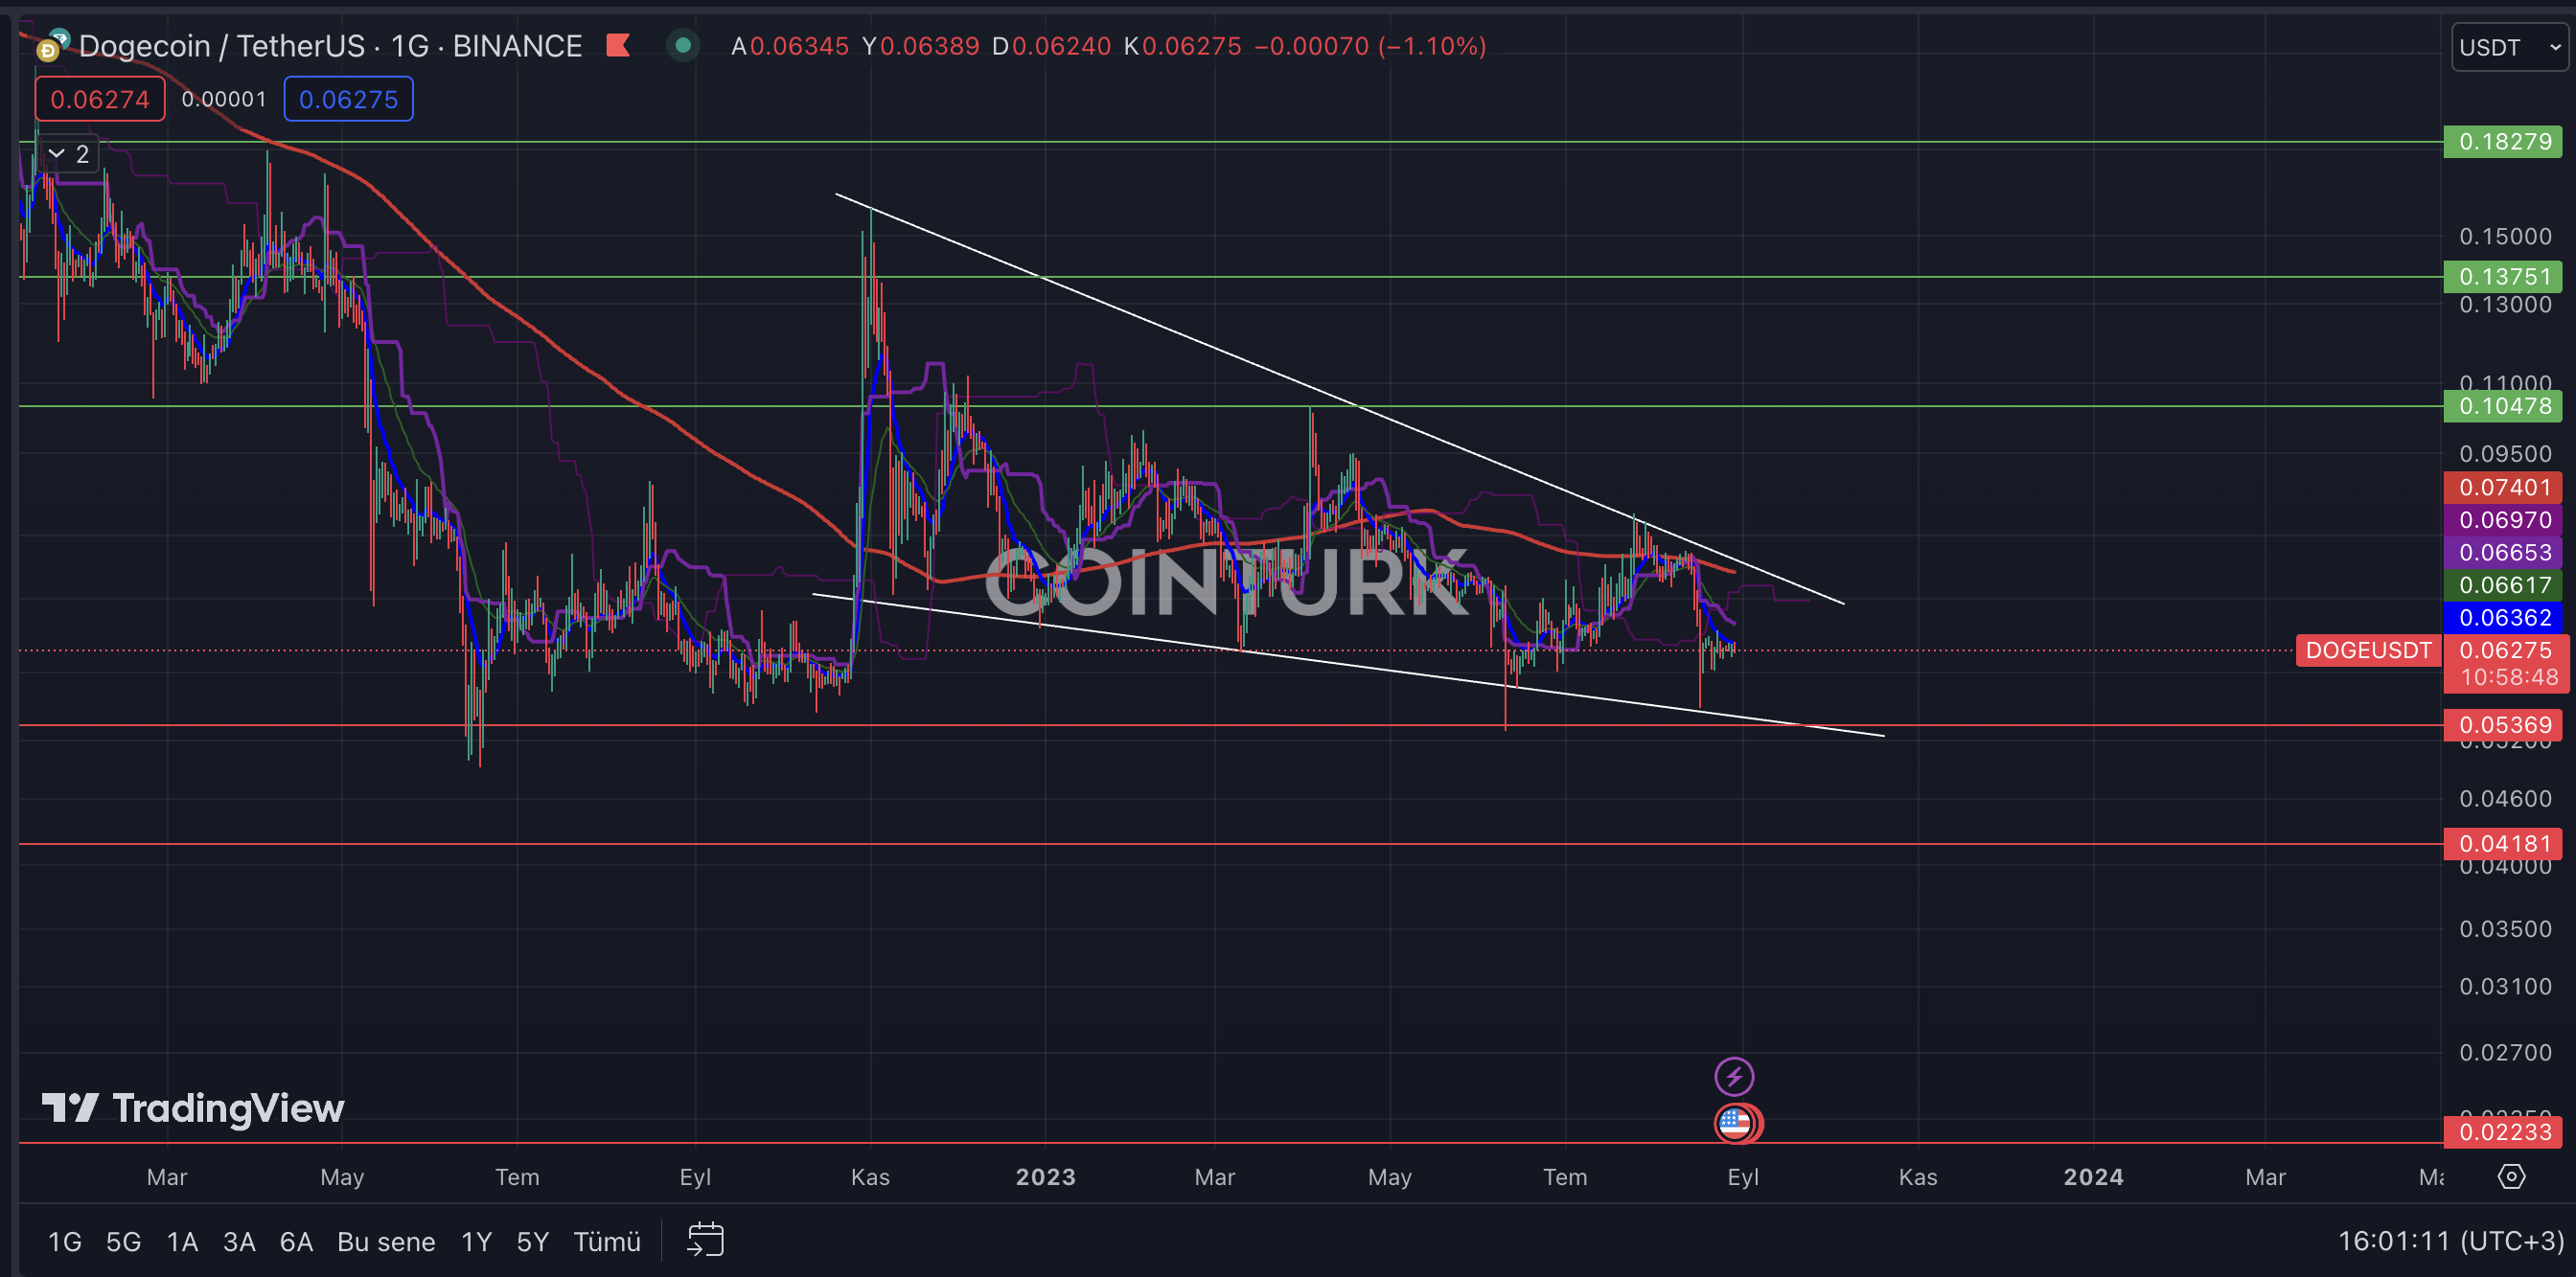
The first noteworthy structure on the daily chart for meme token DOGE, which can overcome all uncertainties with a positive news flow from X, is the flag formation. It is worth noting that although this structure is generally considered bearish and negatively perceived by investors in traditional markets, it should be reminded that things work differently in the cryptocurrency market.

DOGE Support and Resistance Levels
The fact that the formation has not been broken since November 2022 presents us with a perfect structure compared to other altcoins, especially in terms of serving as support. The price only briefly dipped below support in July, trying to scare investors as a bear trap. The support levels that need to be followed for DOGE are as follows: $0.05369, $0.04181, and $0.02233. Especially the $0.05369 level holds vital importance as a well-tested support. Although the $0.02233 level may seem impossible, it appears as the formation target.
The important resistance levels for DOGE, which could completely overturn the negative structure with a positive news flow, are as follows: $0.078, $0.104, and $0.1375. The $0.078 level stands out as the most important resistance since it is above both the daily EMA 200 average and the formation resistance. The $0.18 level should be monitored as the formation target if the resistance is broken.

 Türkçe
 Español


